Elastic Synthetic Monitoring

Making browser-based monitoring easier to create, test, and manage

I led the design of Elastic's Synthetic Monitoring recorder, helping teams create reliable browser-based monitors without depending on lengthy scripts and fragmented configuration workflows.

Role
Lead Product Designer
Team
1 principal PM, 12 engineers, me
Timeline
~6 months to launch
Research
20 customers, ~40 testing sessions
70%
adoption among target users within three months
60%
less time spent on manual UI testing
1,000+
downloads from GitHub in the first months
The Elastic Synthetics Recorder: the start screen, and a recorded journey grouped into named phases beside its test result

The shipped recorder: what you recorded on the left, whether it works on the right.

The challenge

Creating a monitor was highly technical.

Synthetic monitoring lets teams simulate critical user journeys and detect failures before customers encounter them.

But creating those monitors was highly technical. Teams often relied on their most experienced engineers to write and maintain long scripts. Configuration lived across YAML files, remote environments, and tools outside the main product experience.

That made a basic monitoring task expensive to create, and difficult to maintain.

01A skill gapWriting and maintaining a browser journey took an experienced engineer, so monitoring coverage was limited by who was available to script it.
02No UI in the platformConfiguration lived in YAML files and remote environments, outside the product people actually worked in.
03Developer timeHours went into hand-running and hand-maintaining checks that should not have needed a person at all.

The challenge wasn't simply to eliminate code. It was:

How might we turn a technical scripting workflow into a guided product experience without taking control away from advanced users?

Understanding the whole journey

A synthetic monitor is only one part of a much larger operational loop.

Creation, logging and configuration, monitoring, alerting, diagnosis and remediation are connected stages rather than isolated tasks. Our work initially focused on the beginning of that journey: helping users create, understand, validate, and deploy a reliable monitor.

The monitoring lifecycle
01Create
02Configure
03Run
04Monitor
05Alert
06Diagnose
07Remediate
Where this project intervened: creating, configuring, validating and deploying a journey.

Fix the front of the loop and the whole loop starts turning for people who were previously locked out of it.

My role

I led the design effort from discovery through launch.

I led the design effort from discovery through launch, partnering closely with a Principal Product Manager and 12 engineers. My work included:

product and market discoveryresearch planninguser testinginteraction and flow designideation workshopsproduct strategydesign specificationsGitHub issues and engineering ticketsimplementation support

I stayed involved throughout development rather than treating design handoff as the end of the process.

The turning point

Recording wasn't enough.

One of the most important shifts in the project was realizing that capturing browser interactions solved only part of the problem.

A user could record a journey, but they still needed to understand what the system had captured. They needed to:

inspect itedit itorganize itvalidate itunderstand failures

That changed how I thought about the product.

It couldn't simply answer "Can I record my browser?"
It needed to answer "Can I create a monitor I understand and trust?"

That became the foundation for the interaction model.

Evolving the interaction model

From recording actions to building a journey.

Early versions emphasized capturing interactions. The recorded actions existed, but the experience didn't yet provide enough structure for users to reason about longer flows. Through testing and iteration, we evolved toward a clearer step-based model.

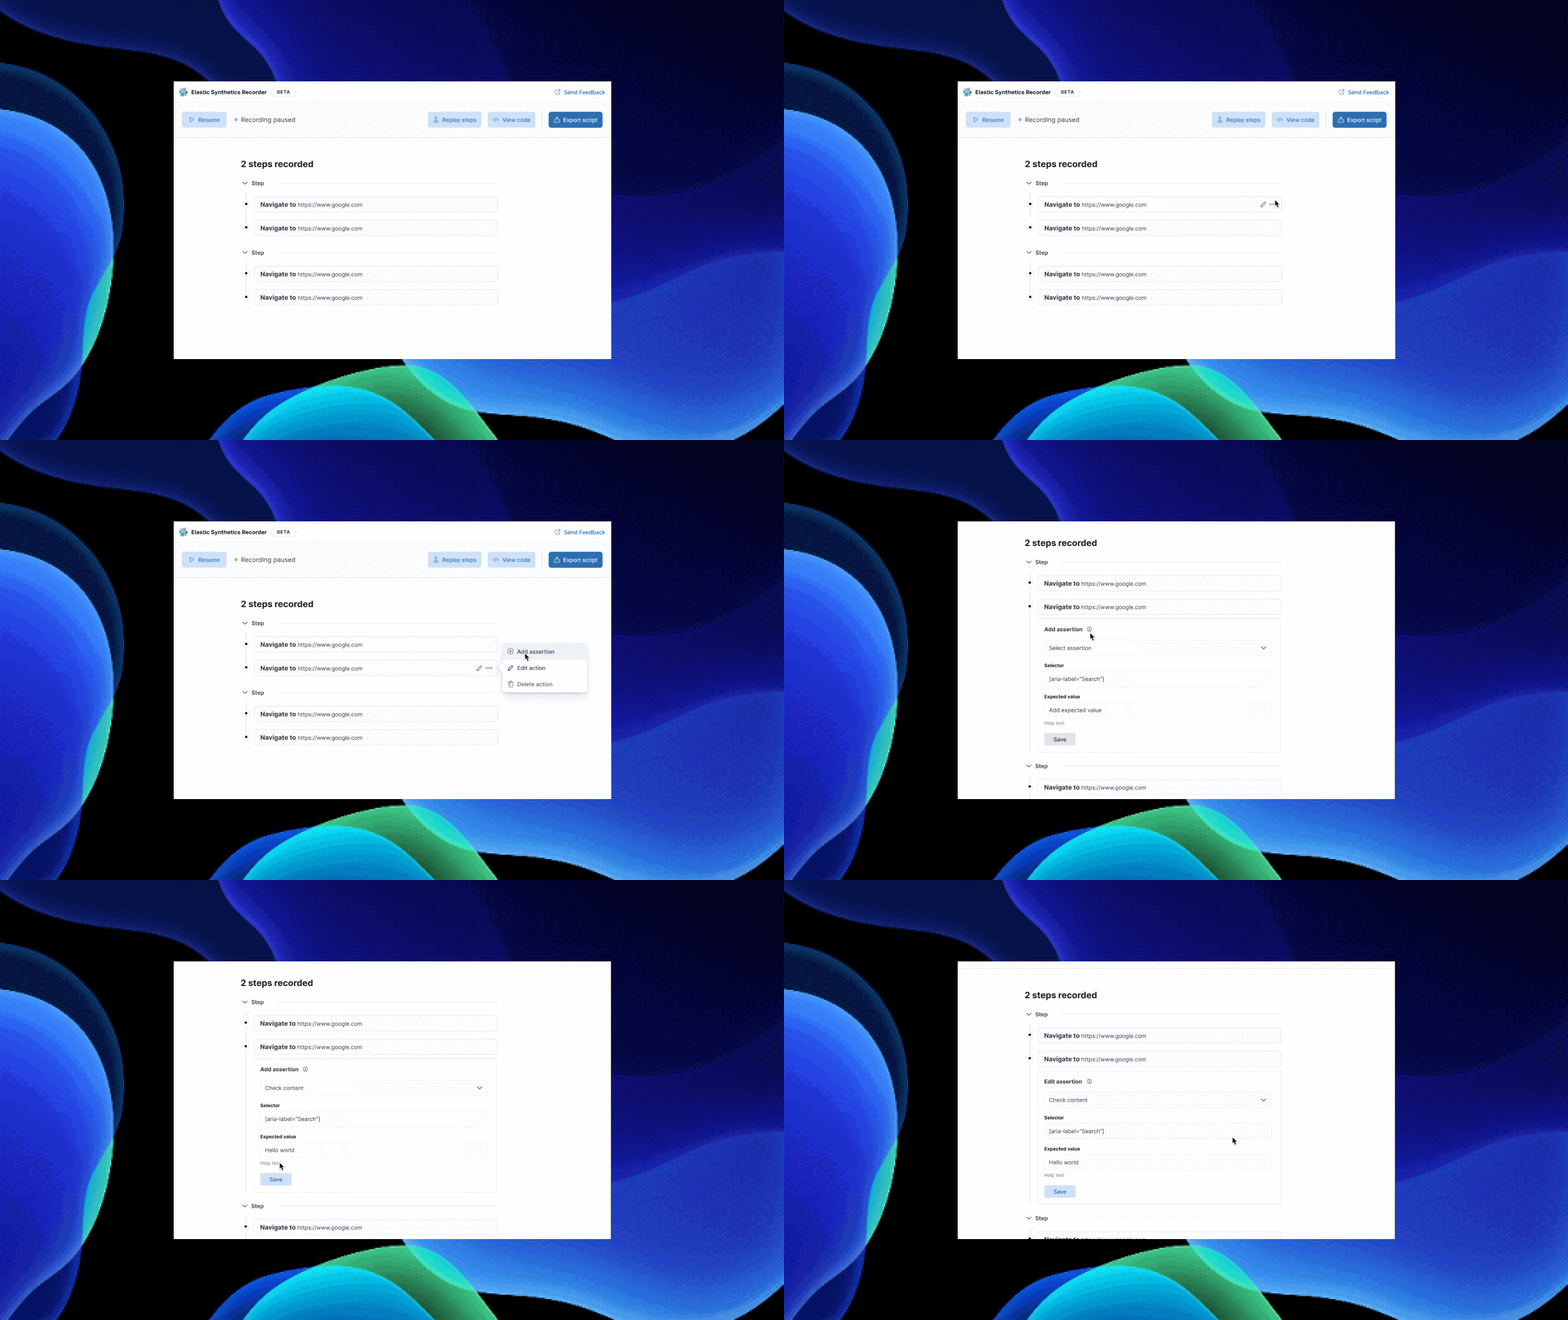
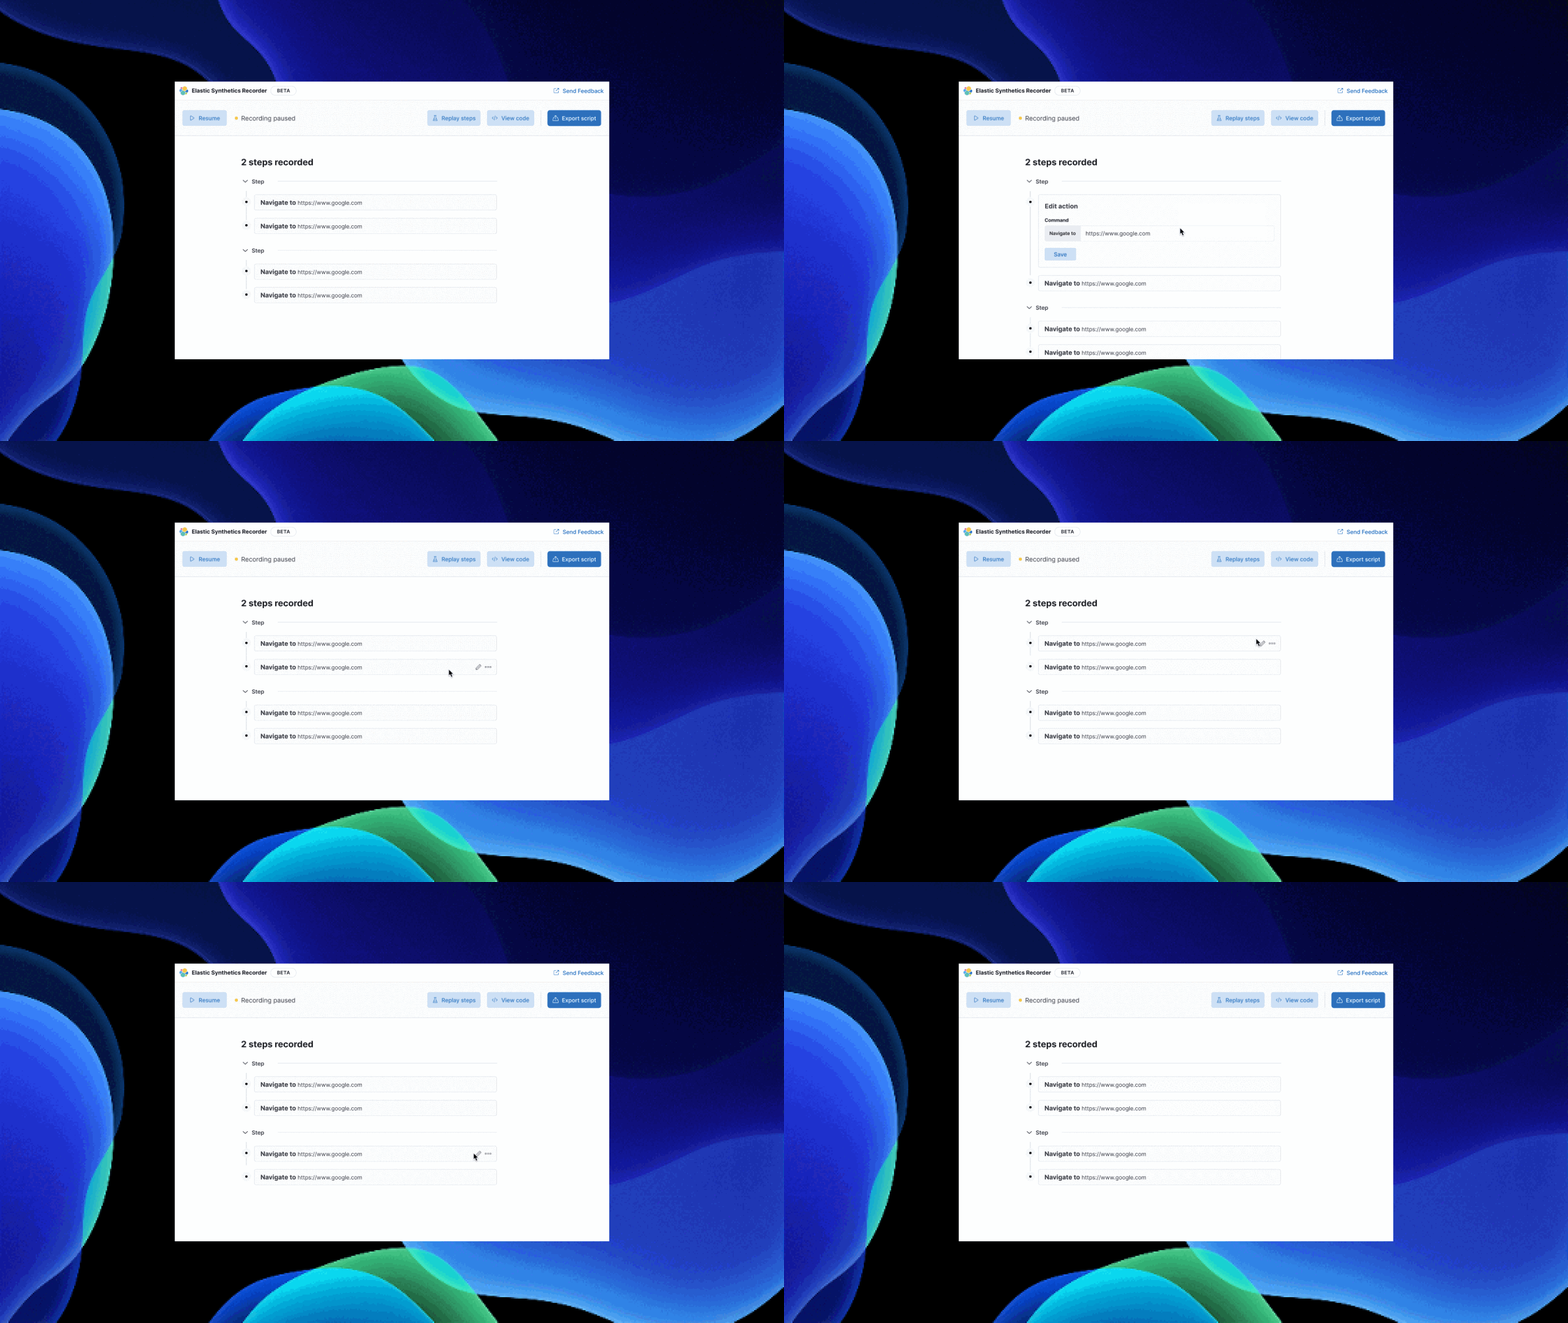
The later version gave recorded actions clearer hierarchy and made their structure easier to inspect and modify.
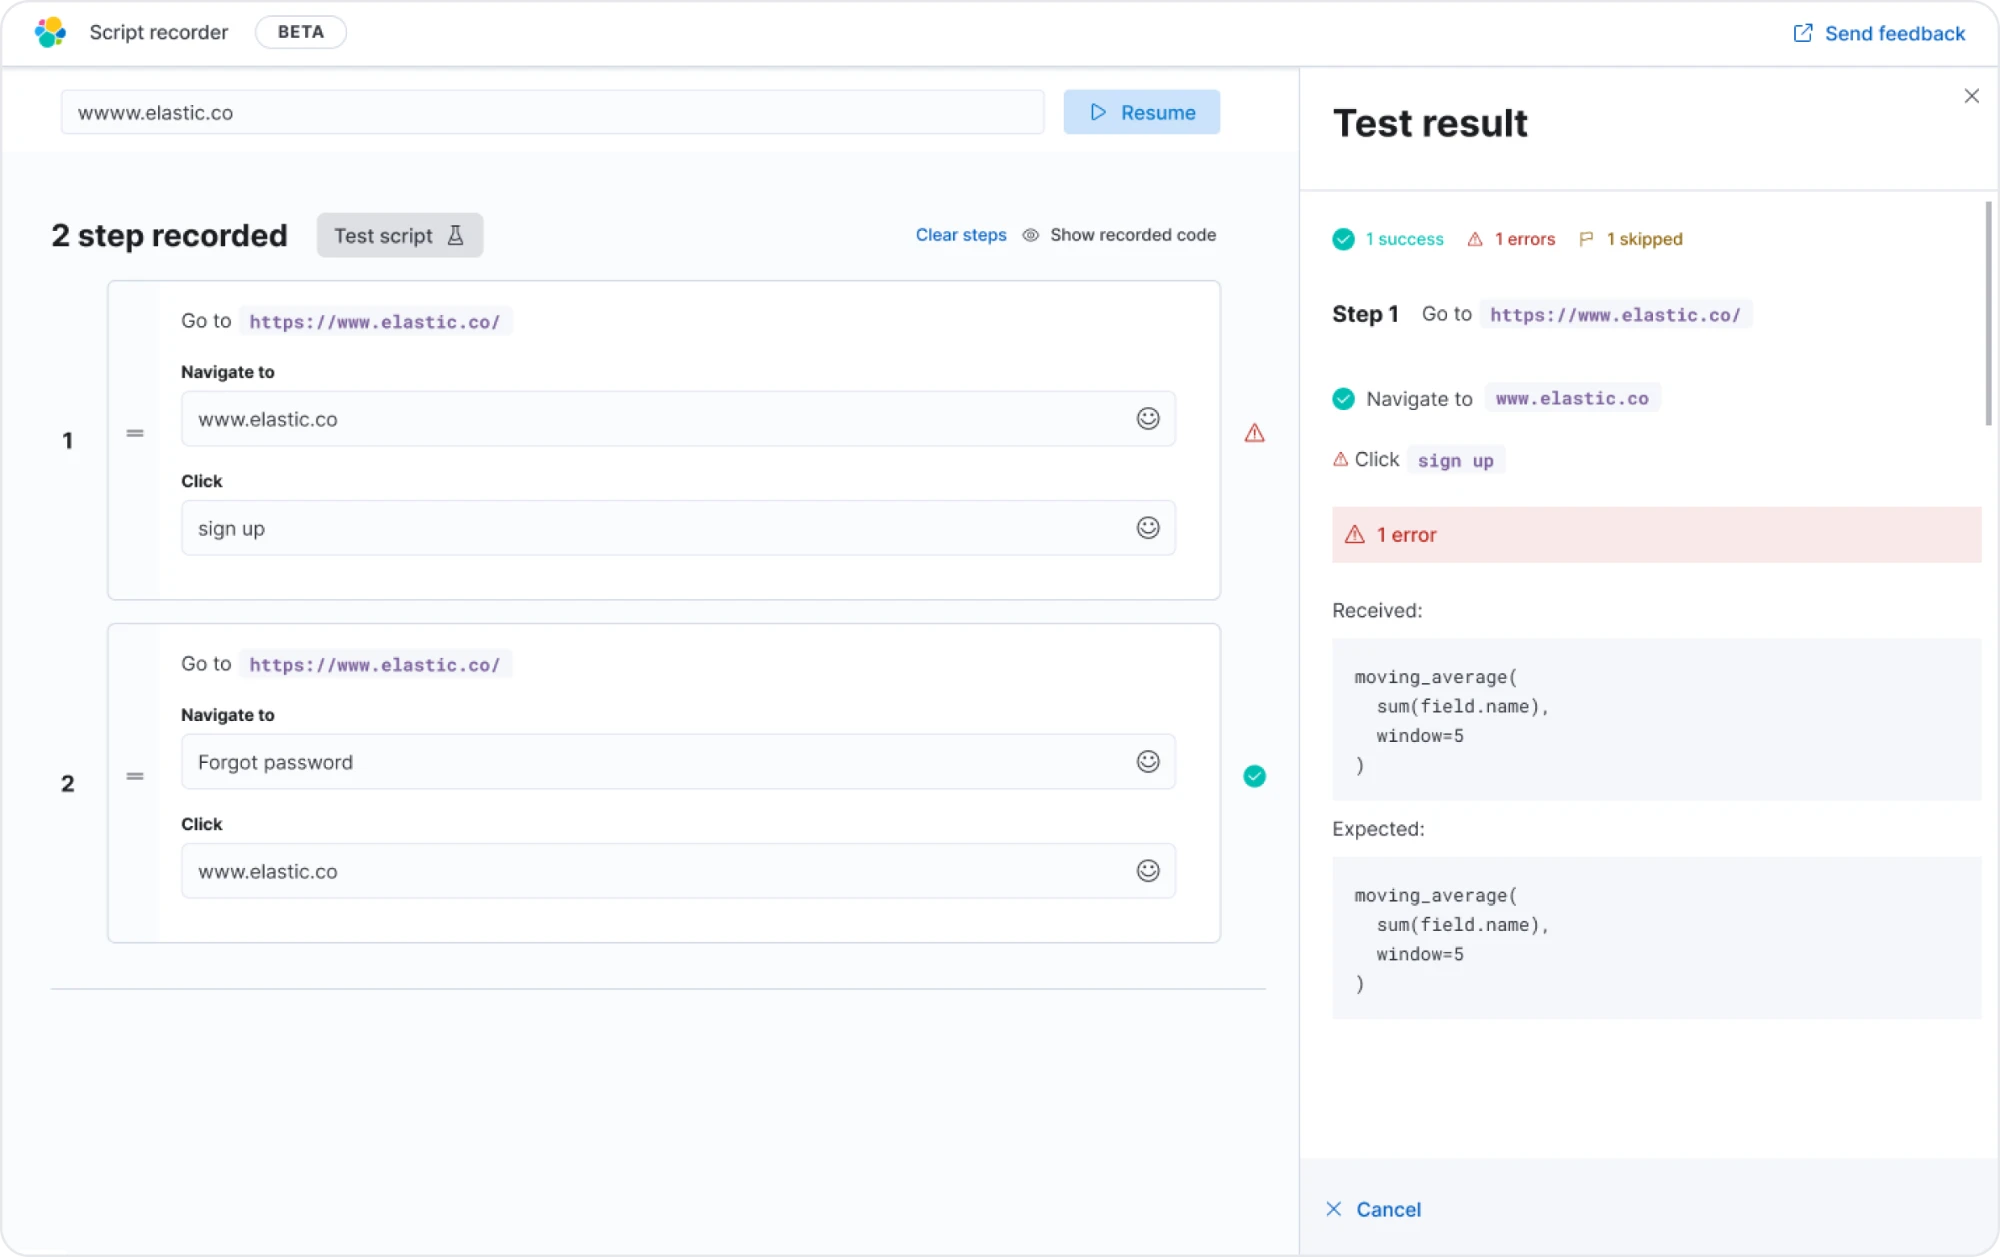
Exploration 01
First exploration: a flat list of recorded actions with every field open, and a test result panel covering the workspace

Flat list. Two actions presented as two "steps", every input open, nothing nameable, nothing groupable. The test result arrives as a panel over the top, reporting a failure you then have to go and find.
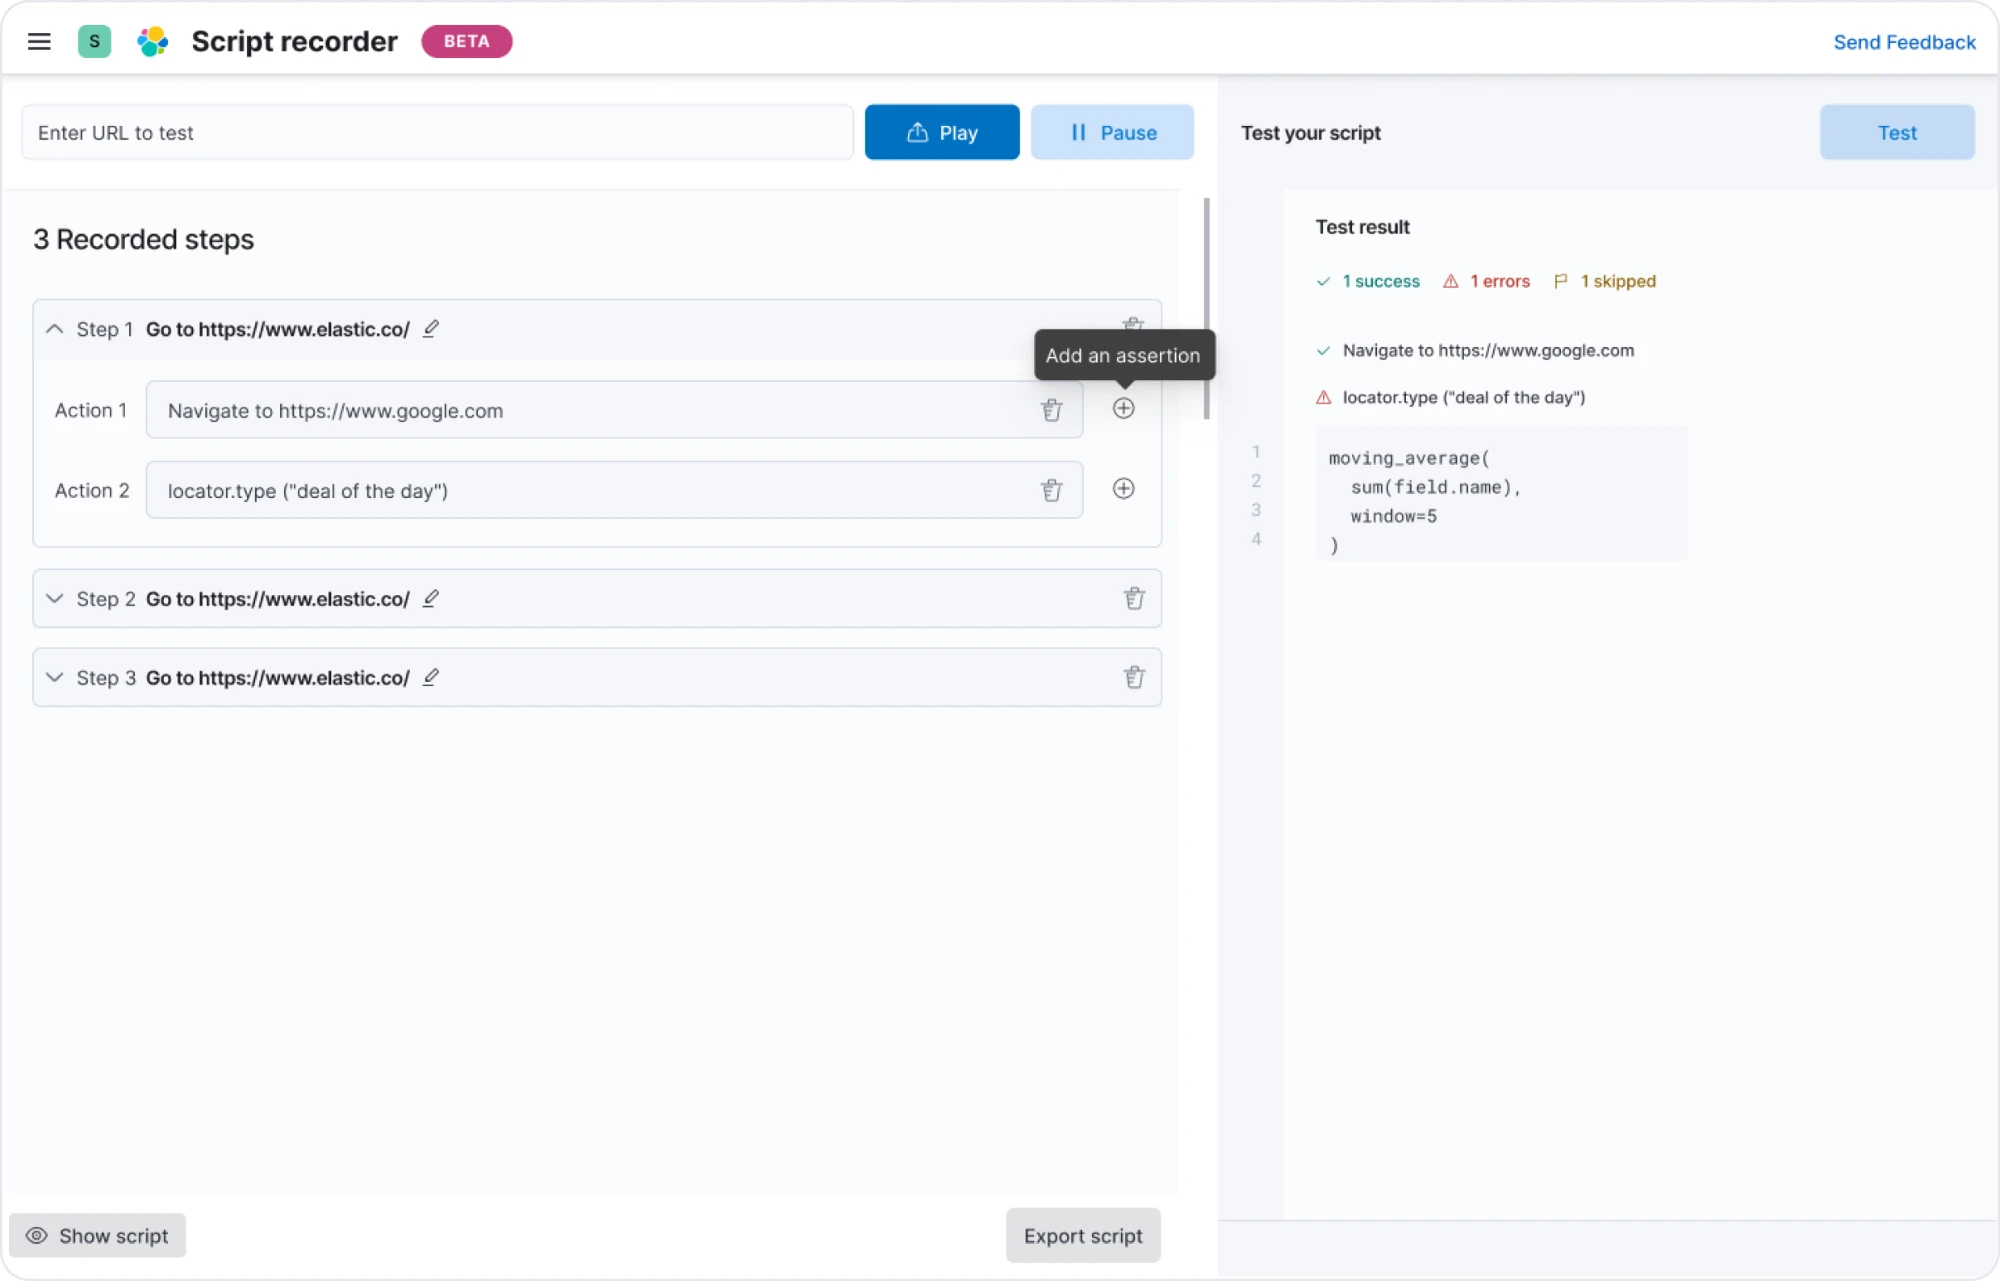
Exploration 02
Second exploration: collapsible steps containing nested actions, with an add-assertion control on each action

The structure arrives. Steps become containers you can name and collapse, actions nest inside them, and assertions get a control of their own. But a step is still called "Step 1", and the result panel still sits apart from the thing it describes.
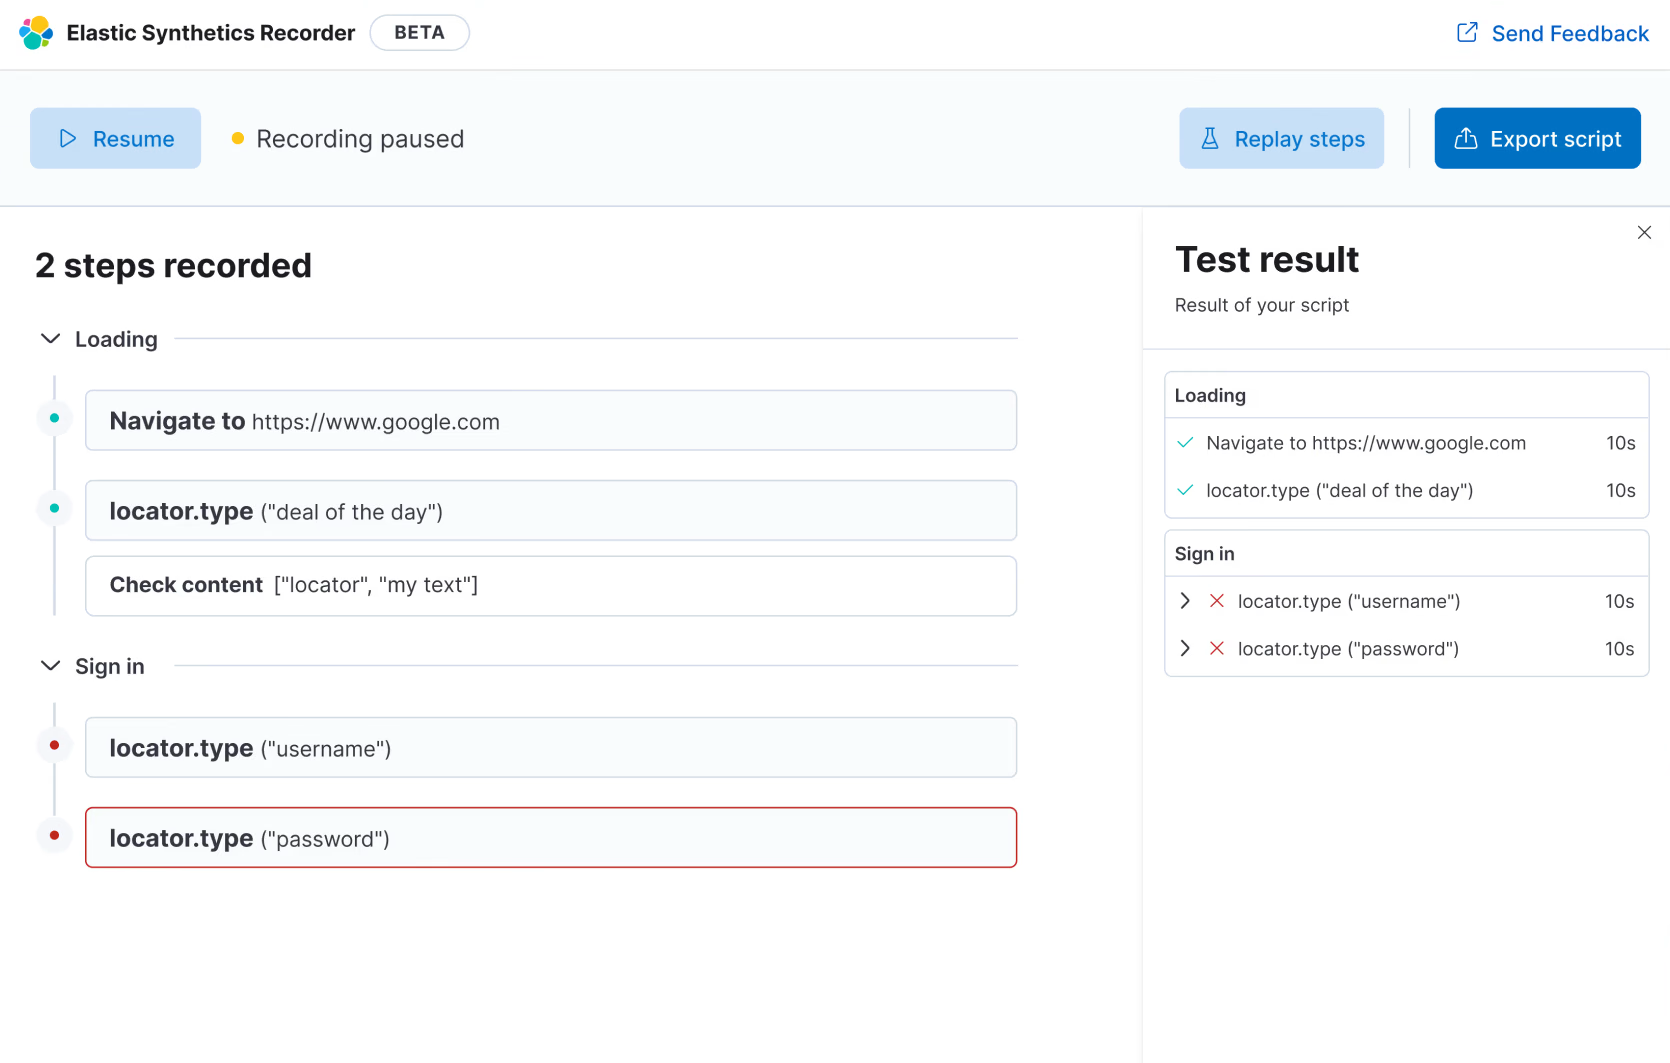
Shipped
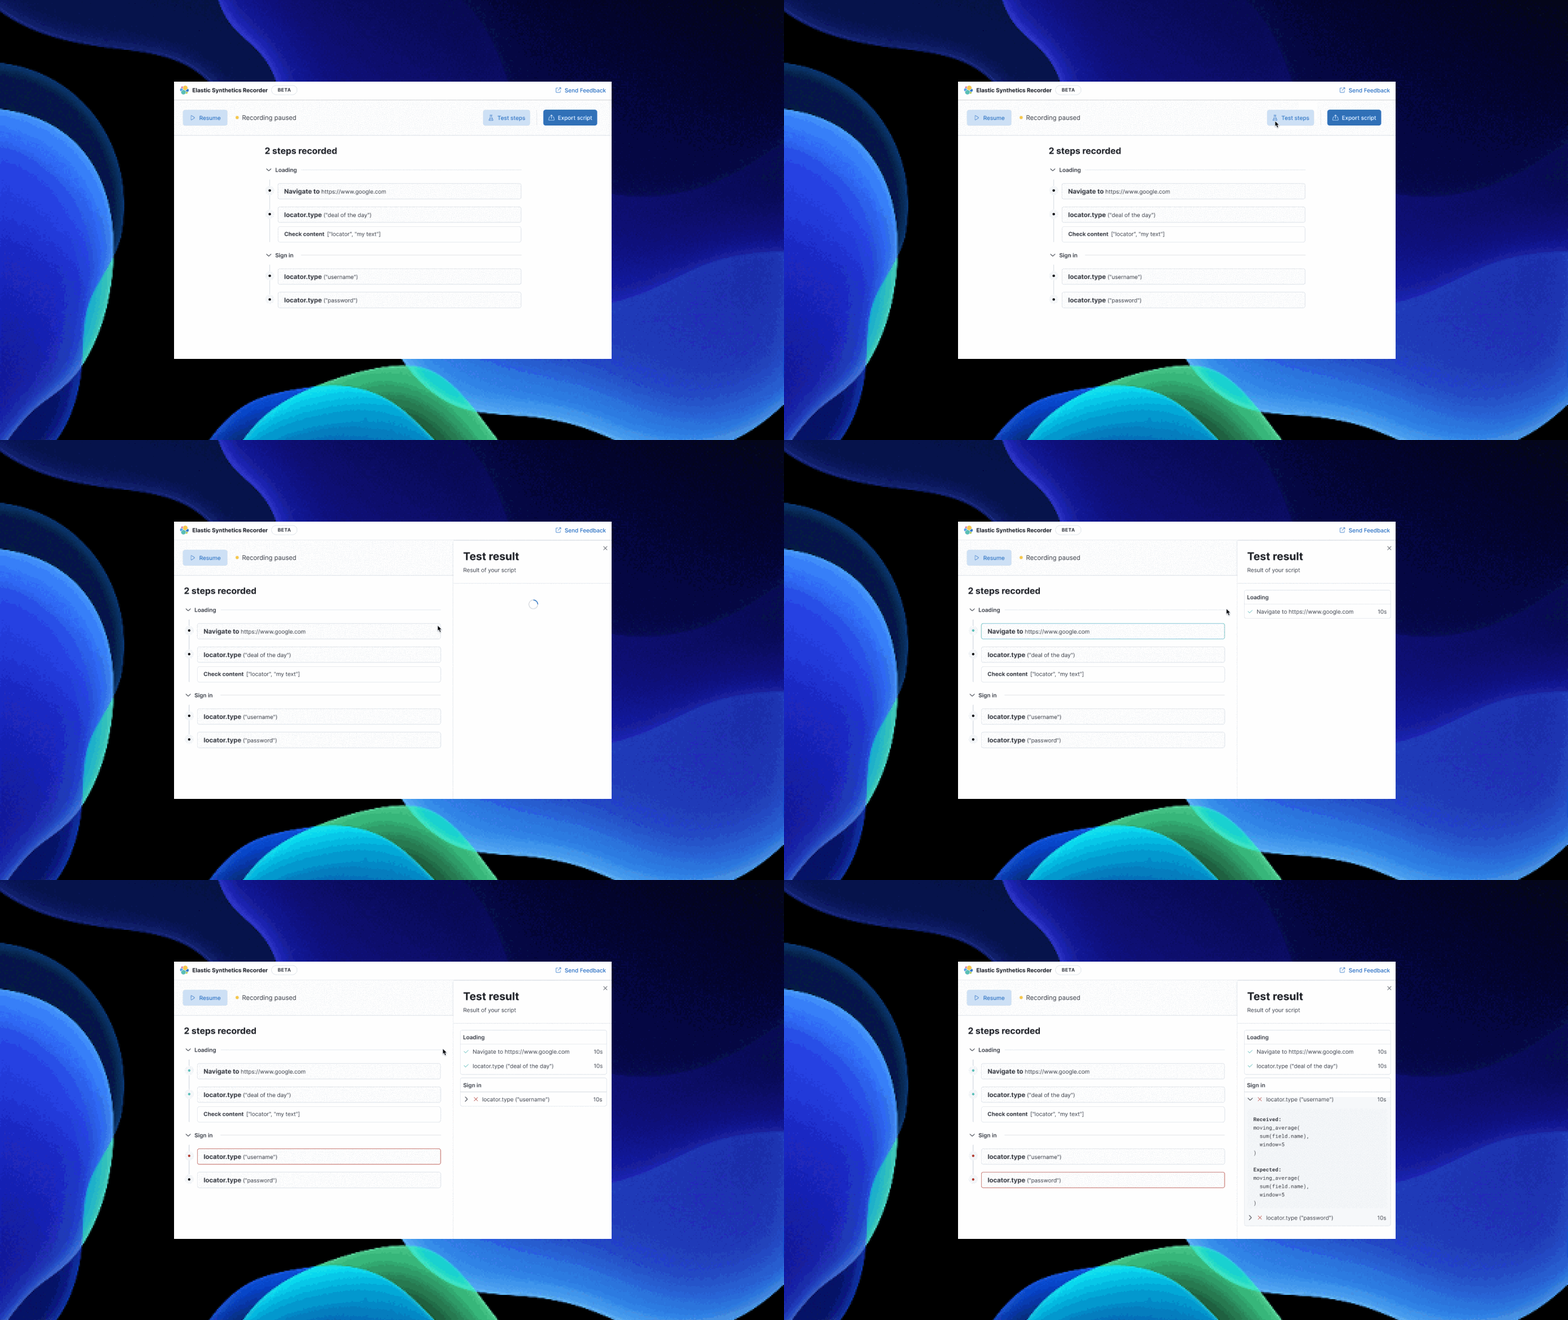
Shipped recorder: steps grouped under named phases, pass and fail state on the timeline, assertions inline, and a test panel mirroring the same grouping 1 2 3
1Phases named in the user's words, Loading and Sign in, not Step 1 and Step 2.
2Pass and fail sit on the timeline itself, and the assertion is a peer of the actions around it.
3The result repeats the same grouping, so a failure is read against the step that caused it.
01Actions became steps, then steps became phasesIn the first build a "step" is one action, so a checkout journey would be thirty flat rows with no shape. The second makes a step a container. The shipped version goes further and lets that container be named after what the user was doing, so the journey reads Loading, Sign in, Checkout rather than Step 1, Step 2, Step 3.
02Everything open became open on demandShowing every field of every step is fine at two steps and unreadable at twenty. Collapsing by default is what lets one screen carry a journey long enough to be worth monitoring.
03Assertions moved from a control to a peerThere is nowhere in the first build to say what must be true. The second adds a button for it. The shipped version puts the assertion in the list alongside the actions, at the same weight, because an assertion is part of the journey rather than an annotation on it.
04The result stopped being a separate documentFirst it covered the workspace, then it sat beside it, and finally it mirrored it. Repeating the same Loading and Sign in grouping in the result panel is what turns "1 error" into "the password step failed", without the person having to hold the mapping in their head.

None of this changed what the tool recorded. All of it changed whether someone could look at the result and decide to trust it.

Designing validation into the workflow

Recording describes what happened. Assertions describe what must be true.

Replaying interactions isn't enough for monitoring. A monitor needs to know whether the expected outcome actually occurred. We introduced editable assertions that allowed users to define:

Users could update or delete assertions directly within the recorded journey. This moved the product beyond simple browser automation. It gave users a way to encode what success meant.
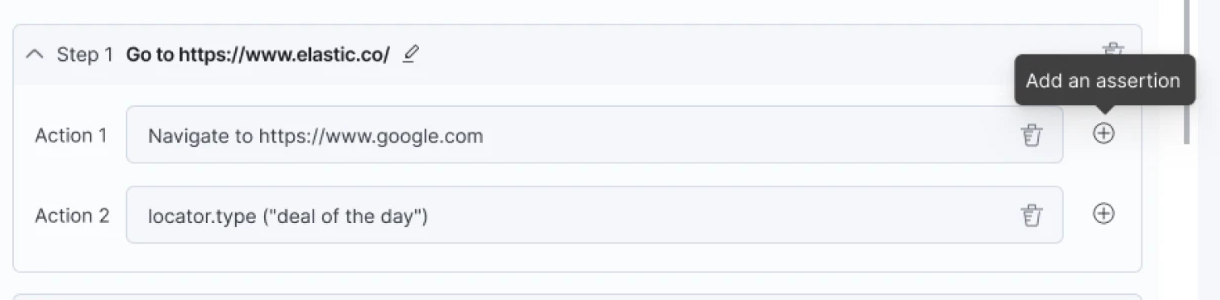
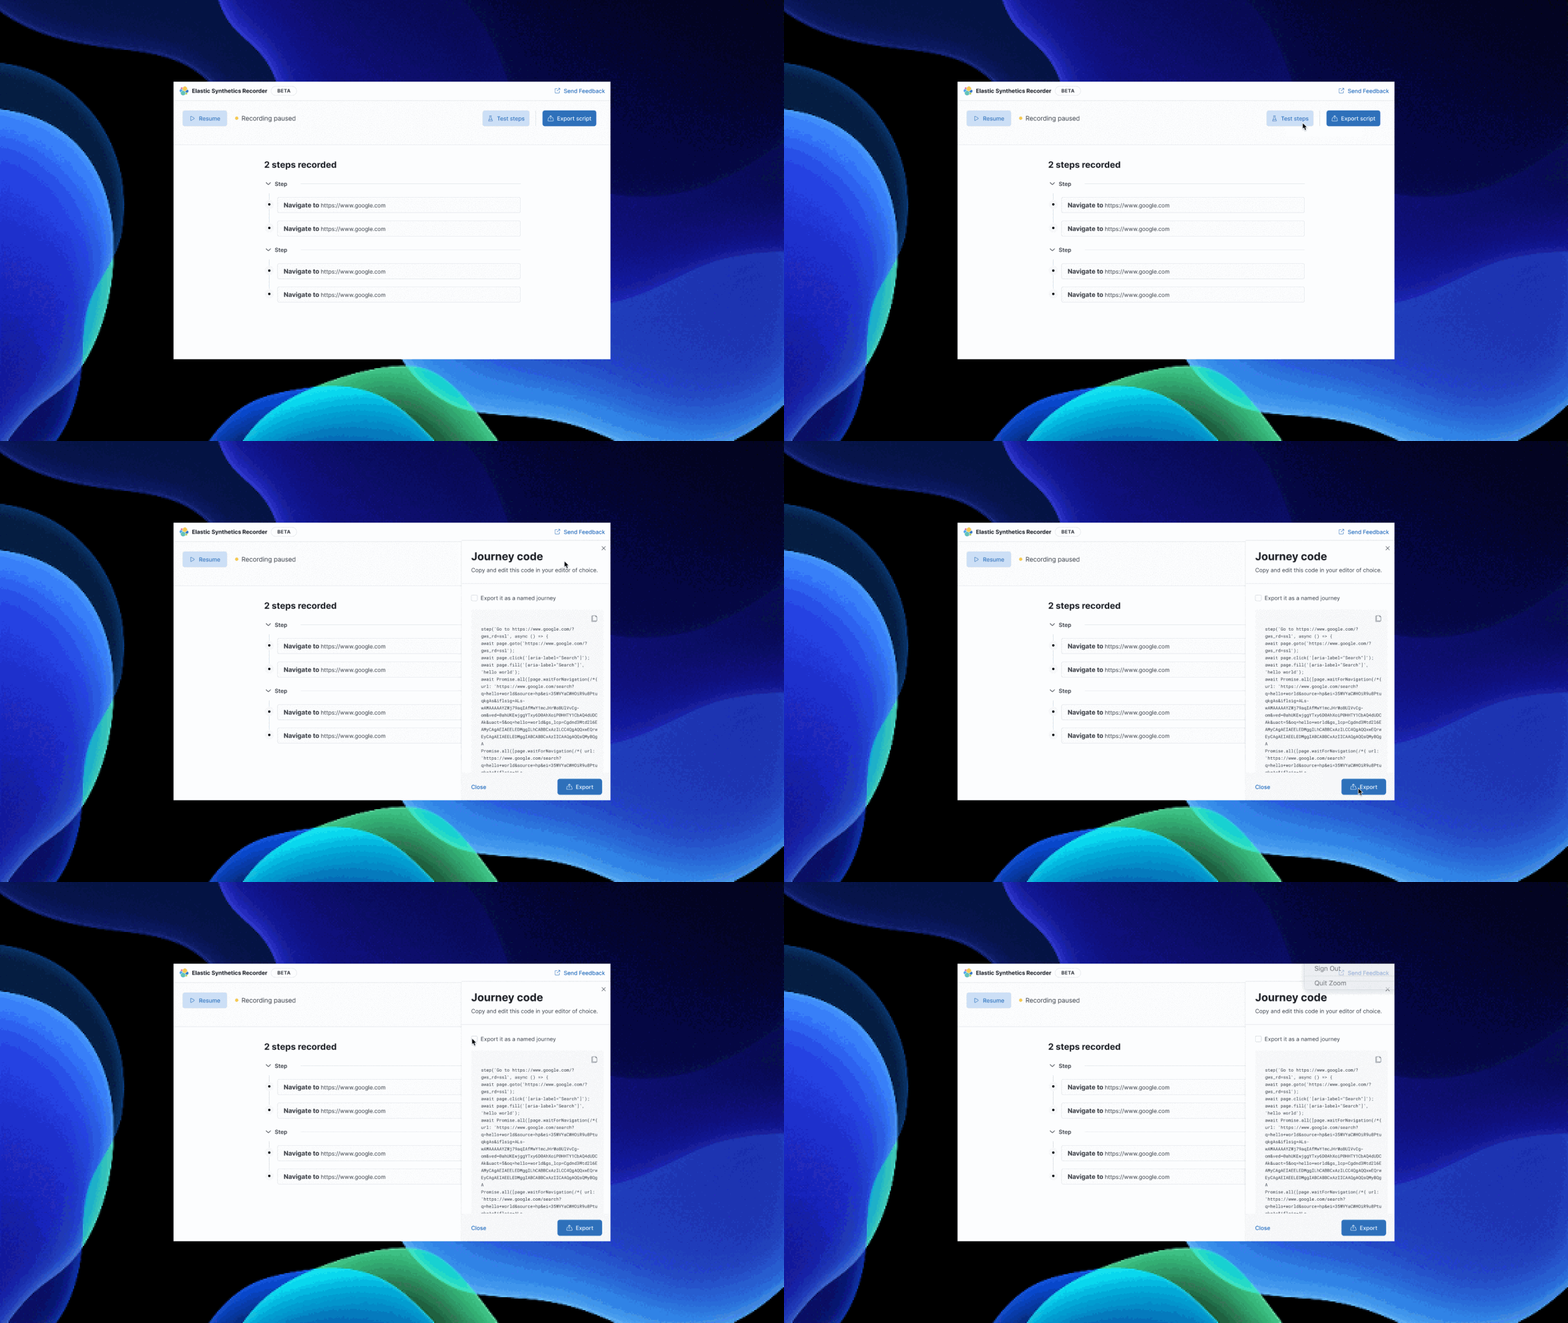
A recorded step with two actions, each carrying an add-assertion control, and the step name editable inline

Every action carries its own add-assertion control, so saying what must be true happens where the action already is, rather than in a separate mode. The step name is editable in place, which is what lets a long journey be read as phases instead of a list.

typeselectorexpected value

Three things, editable and removable inside the journey. That is the whole vocabulary needed to say what success means at a given point, and holding it to three is what kept assertions from becoming a second product.

Making complex journeys understandable

Users needed structure, not more actions.

As recorded journeys became longer, another problem emerged: individual actions weren't enough to communicate the meaning of the flow. Users needed structure. We introduced dividers and editable step names so actions could be grouped into meaningful stages of a journey.

Sign in
  • navigate
  • enter username
  • enter password
  • submit
  • Checkout
  • add item
  • open cart
  • submit payment
  • A small interaction decision created a much clearer mental model.

    Closing the feedback loop

    A script isn't useful if the user can't trust it.

    After recording a journey, users needed a way to verify that it actually worked. We added testing directly into the recorder. The result view summarized successful, skipped, and failed steps so users could identify problems before deploying the monitor.

    This was an important shift from a recording tool toward an environment for building and validating monitoring journeys.

    The loop the test runner closed
    Record
    Inspect
    Test
    Correct
    Deploy

    Before the runner, the loop broke after Record: you exported, ran it somewhere else, and found out. Closing it inside the tool means the person who made the journey is the one who sees it fail.
    Elastic Synthetics Recorder
    The run happens inside the recorder, so a broken journey is found here rather than after export in someone else's pipeline
    1. 1Record interactionsClick through the site, no code
    2. 2Read the timelineEvery action becomes a step
    3. 3Edit the scriptDefaults for most, selectors for experts
    4. 4Export the testReadable JavaScript an engineer will own
    Record, inspect, edit, export as one continuous pass, because every handoff between tools was a place the original workflow lost people
    Designing beyond the recorder

    The recorder was only one part of the system.

    Users ultimately needed to take what they created and operate it within Elastic's broader Synthetic Monitoring experience. That meant connecting the Electron-based recorder with monitor configuration and ongoing monitoring in the Elastic platform.

    The flow, and where it changes hands
    Front-end engineerSynthetics Recorder · desktop
    01Record a scriptClick through your own site
    02Export itReadable JavaScript
    script.jschanges hands here
    DevOpsKibana · Observability
    03Create a monitorAttach the script to something that runs it
    04Set the scheduleHow often, and which locations
    05Watch itMonitors homepage and dashboards

    The seam is a person, not a file. A front-end engineer produces the script; a DevOps engineer decides how and where it runs, and owns the site's performance afterwards. Designing that crossing, rather than leaving it between two backlogs, was most of the work.
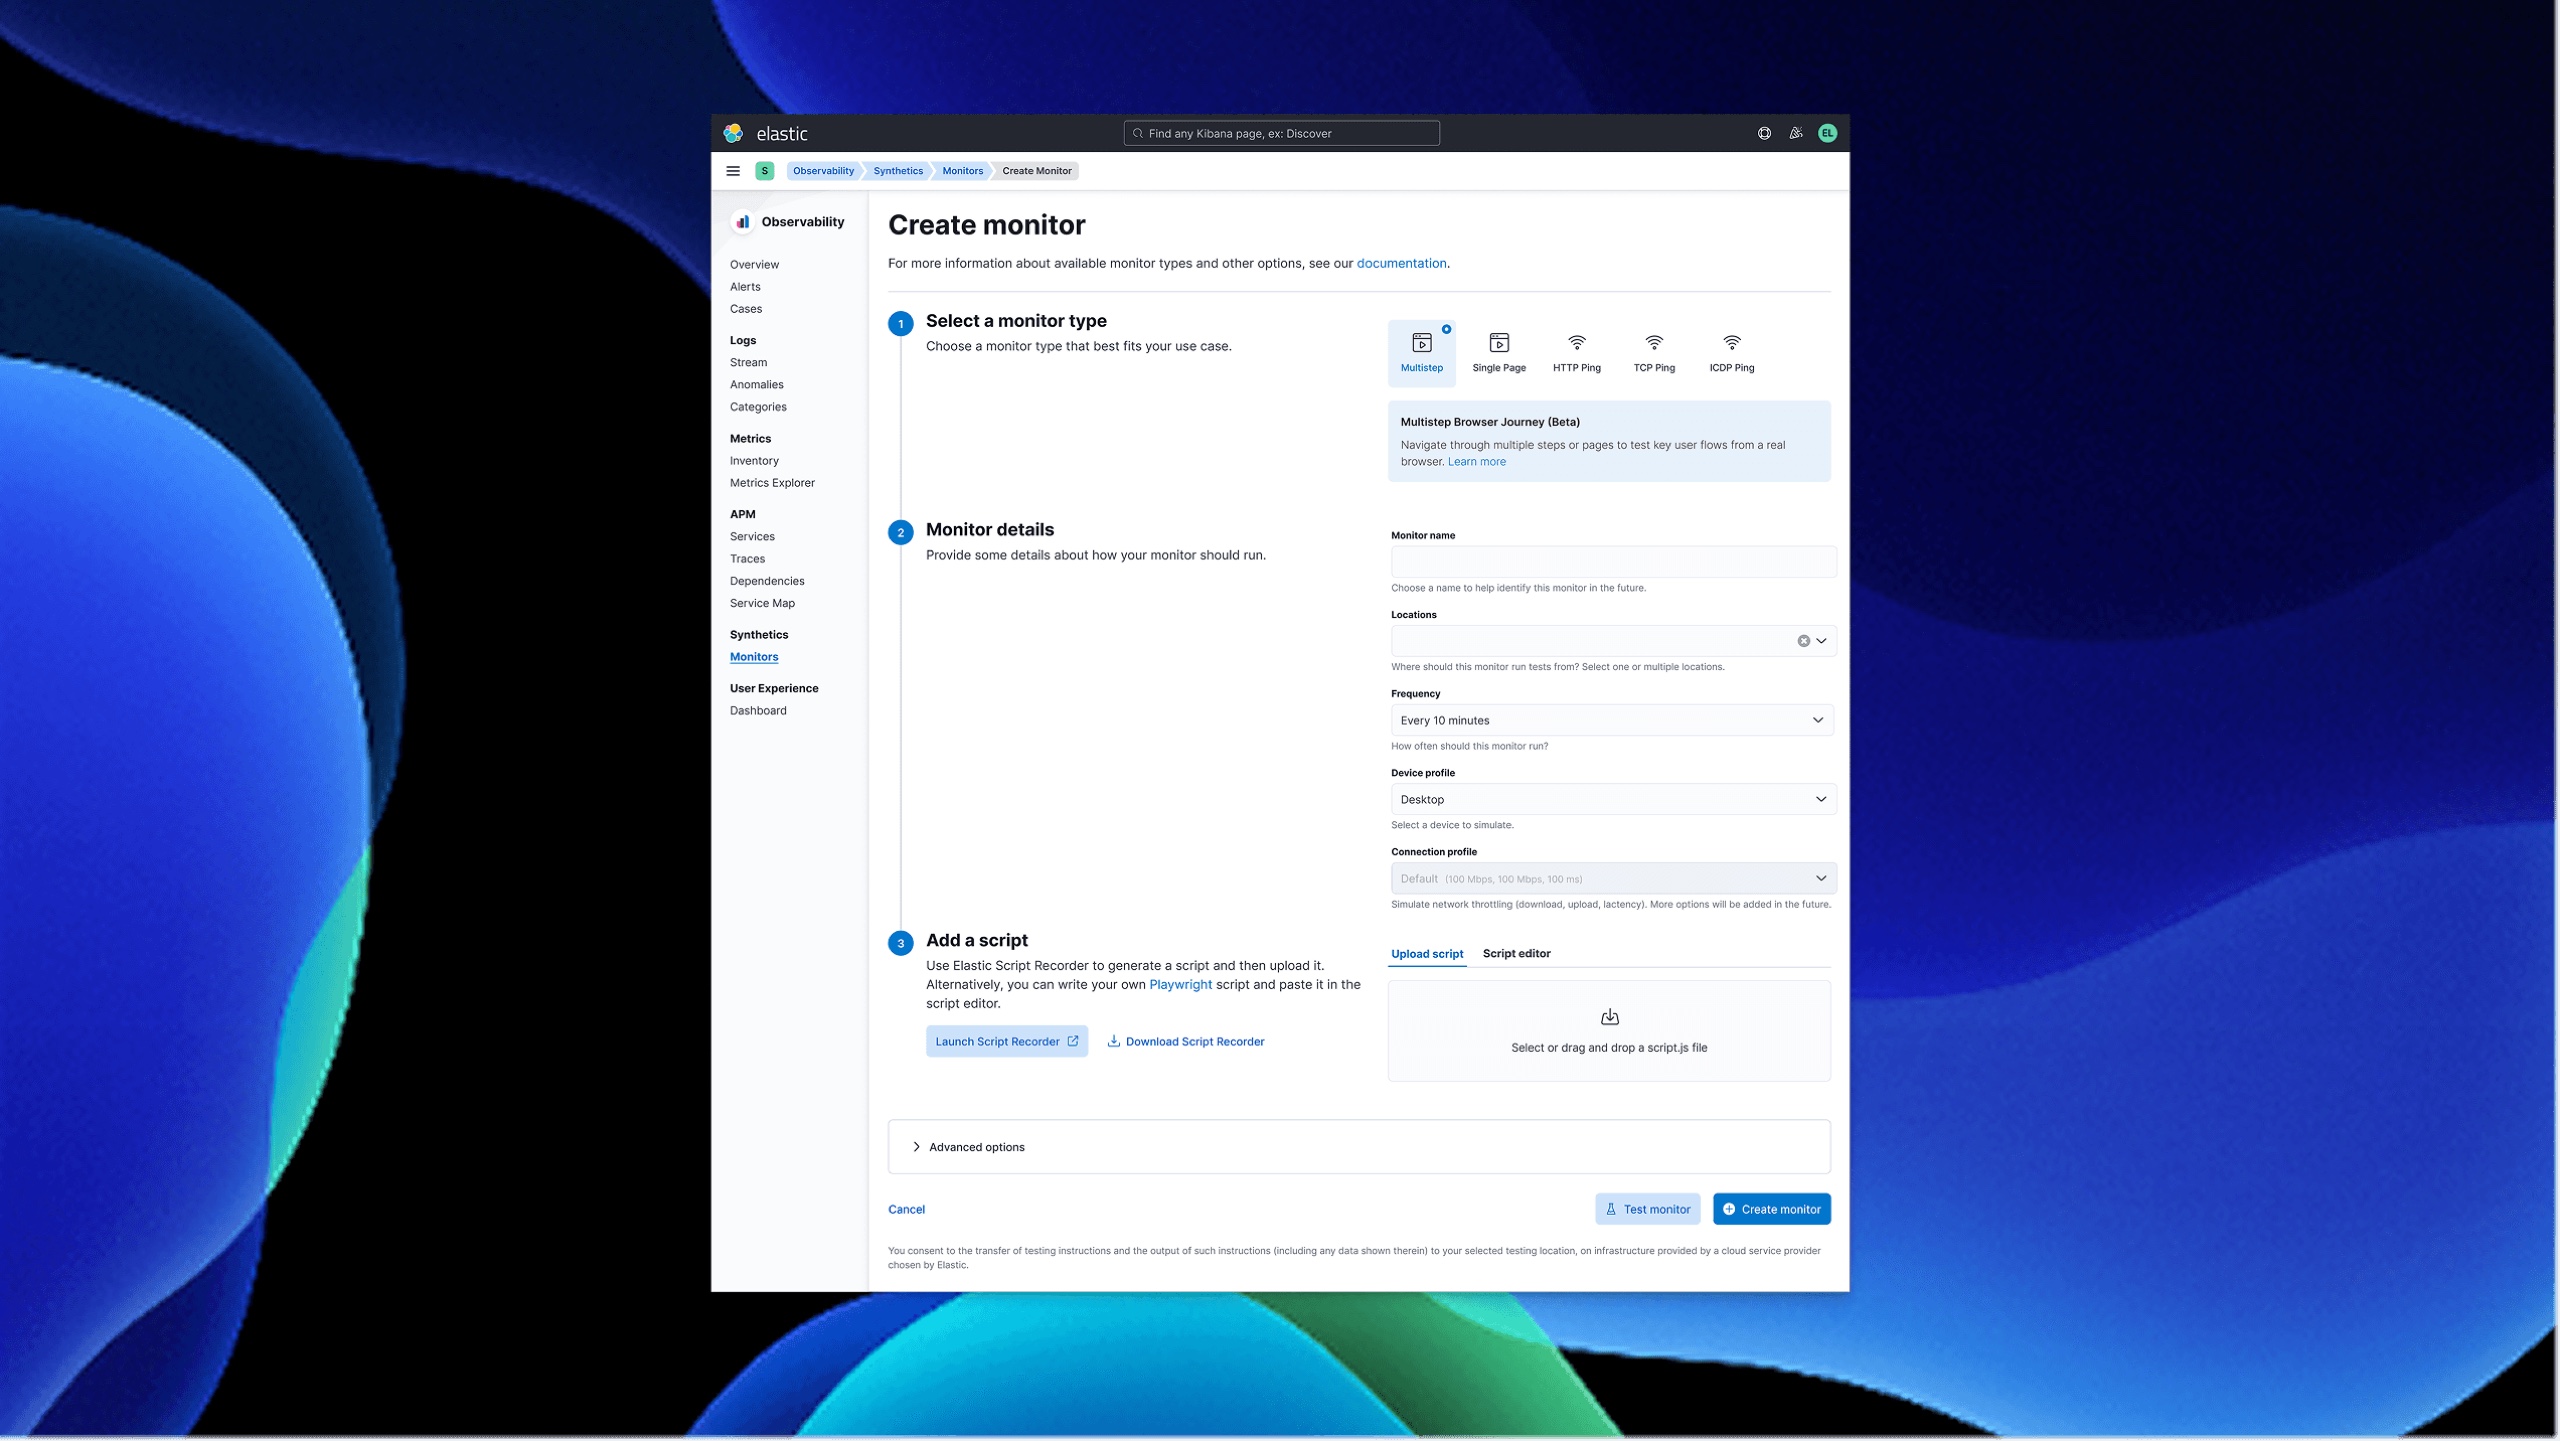
    app.elastic.co/observability/synthetics
    Creating a synthetic monitor: type, name, locations, frequency, and uploading the recorded script
    The handoff on one screen: a multistep browser journey sits in the same type list as the existing pings, with frequency and locations chosen here rather than hidden in advanced options
    Working closely with engineering

    The interface represented executable browser journeys.

    Because the interface represented executable browser journeys, the interaction model couldn't be designed independently from the underlying implementation.

    I worked directly with engineering throughout the project, creating detailed interaction specifications, flows, design documentation, and GitHub issues.

    That collaboration allowed us to work through product behavior and technical constraints together instead of resolving them after handoff.
    What we shipped

    Script Recorder, and the monitoring around it.

    01Script RecorderCapture browser interactions and turn them into editable monitoring journeys.
    02Monitor CreationConfigure monitors and connect recorded journeys to Elastic's monitoring platform.
    03Broader monitoring experienceThe work contributed to a wider Synthetic Monitoring experience including monitor creation, unified views, visualization, and script recording.
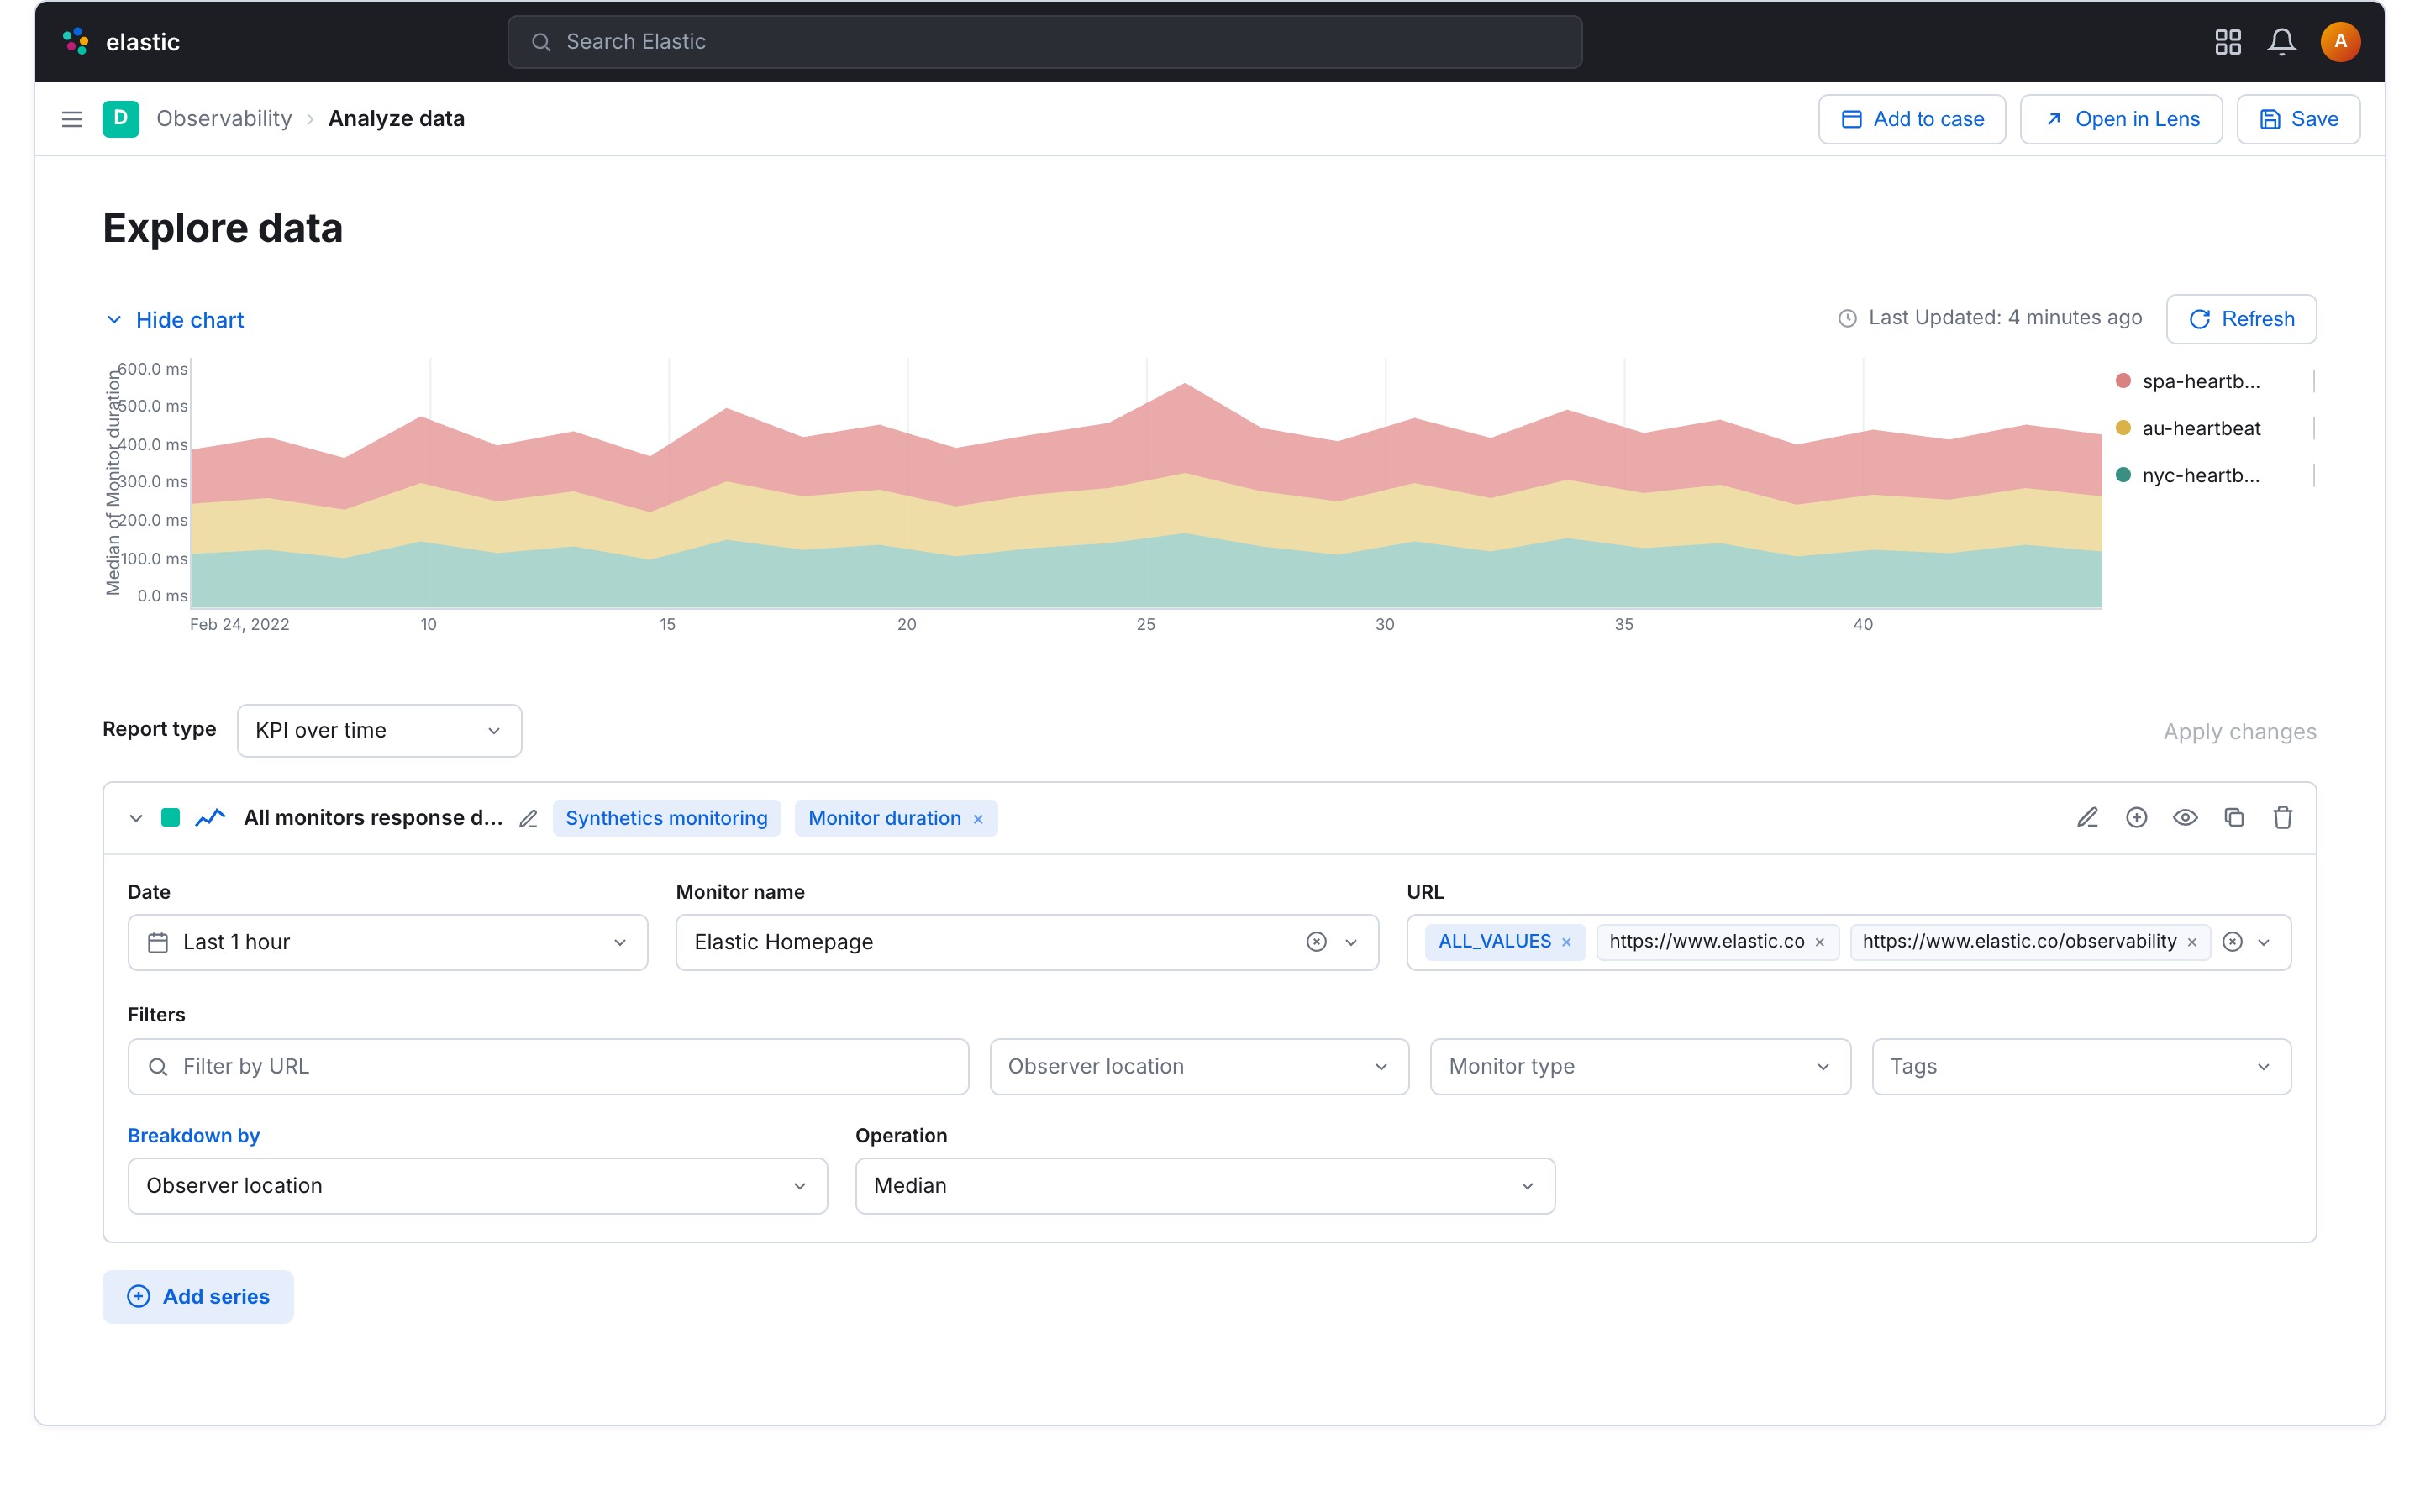
    app.elastic.co/observability
    Exploratory View, monitor duration broken down by location
    Monitor duration broken down by location by default, because a regional failure disappears inside an average
    Impact
    70%
    Adoption among the target user base within three months
    60%
    Less time required for manual UI testing
    1,000+
    GitHub downloads in the first months after launch

    The Synthetic Monitoring product achieved 70% adoption among the target user base in its first three months.

    The UI script reduced manual testing time by 60%, allowing the development team to spend more time on product improvements.

    The recorder exceeded 1,000 downloads within its first months after launch.

    And it lasted

    The flow outlasted the redesigns.

    The recorder is open source. The repository opened in August 2021 and is still being committed to, and you can read the whole release history rather than take my word for any of it.

    Record, edit, ship survived five years of dependency churn, platform changes and new maintainers without the model itself being reworked.

    What I took away

    Simplifying a technical product doesn't mean removing complexity.

    The biggest lesson from this project was that simplifying a technical product doesn't mean removing complexity. It means deciding which complexity users need to see, when they need to see it, and how much control they need at that moment.

    The recorder became more useful when we moved beyond simply automating browser interactions and gave users ways to understand, structure, validate, and correct what the system created.

    The project also reinforced how important close engineering collaboration is when interaction design maps directly onto technical behavior.

    Go to next →