app.us.jupiterone.io/vulnerabilitiesLive prototype
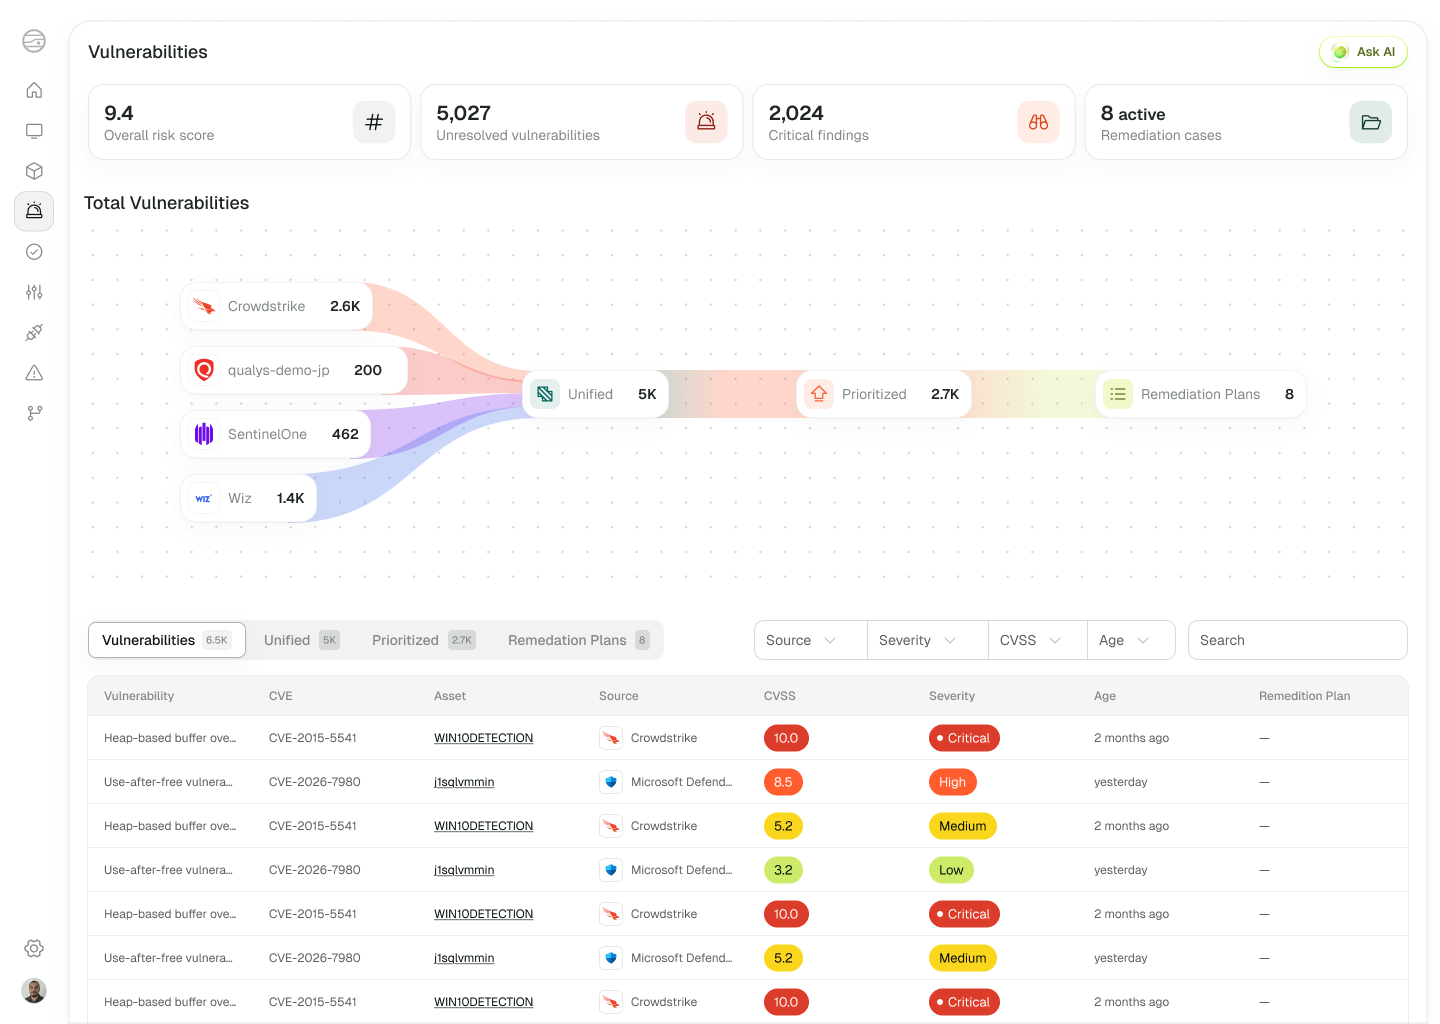
Vulnerabilities after the rebuild: findings unified across sources, prioritised, and paired with a remediation plan. Live prototype, click through it.
JupiterOne · AI risk & compliance platform
The graph held millions of assets, identities and relationships, but the interface in front of it had stopped keeping up.
The same control had been rebuilt a dozen different ways, with no shared source of truth. Every workflow behaved a little differently, performance buckled as graphs grew into the millions of entities, and nothing on screen suggested the intelligence underneath.
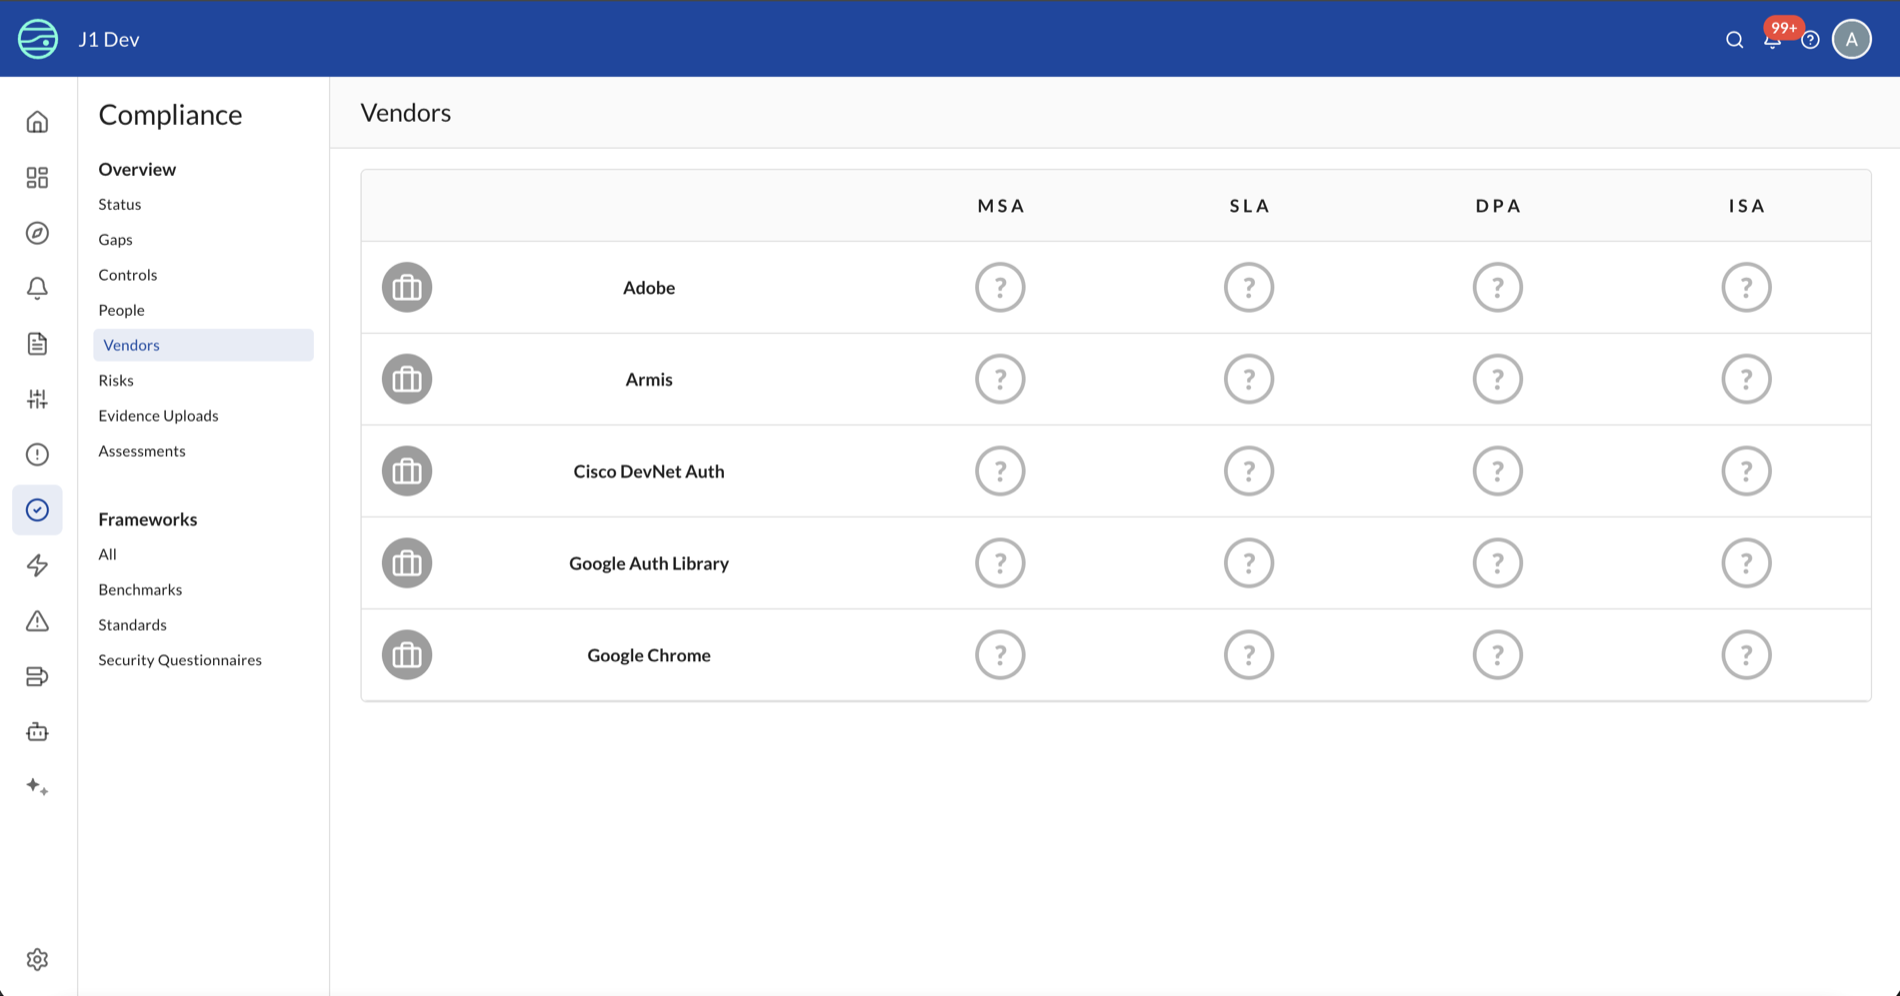
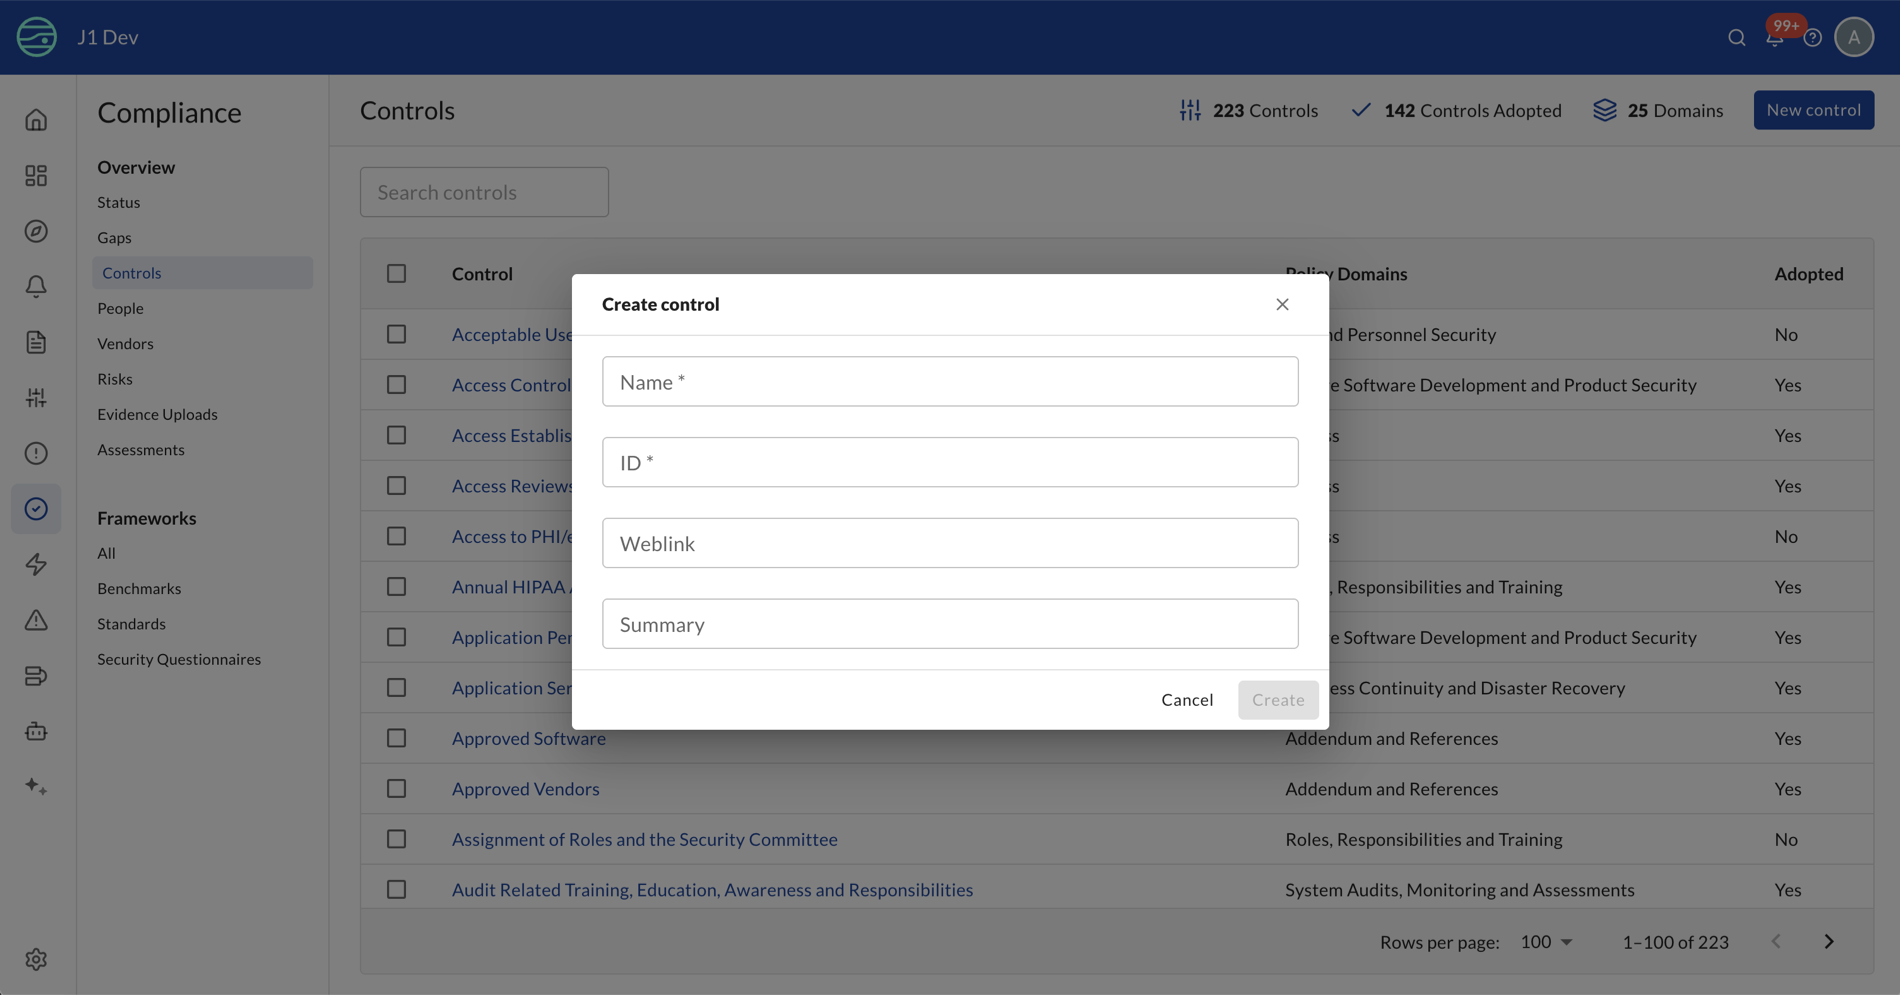
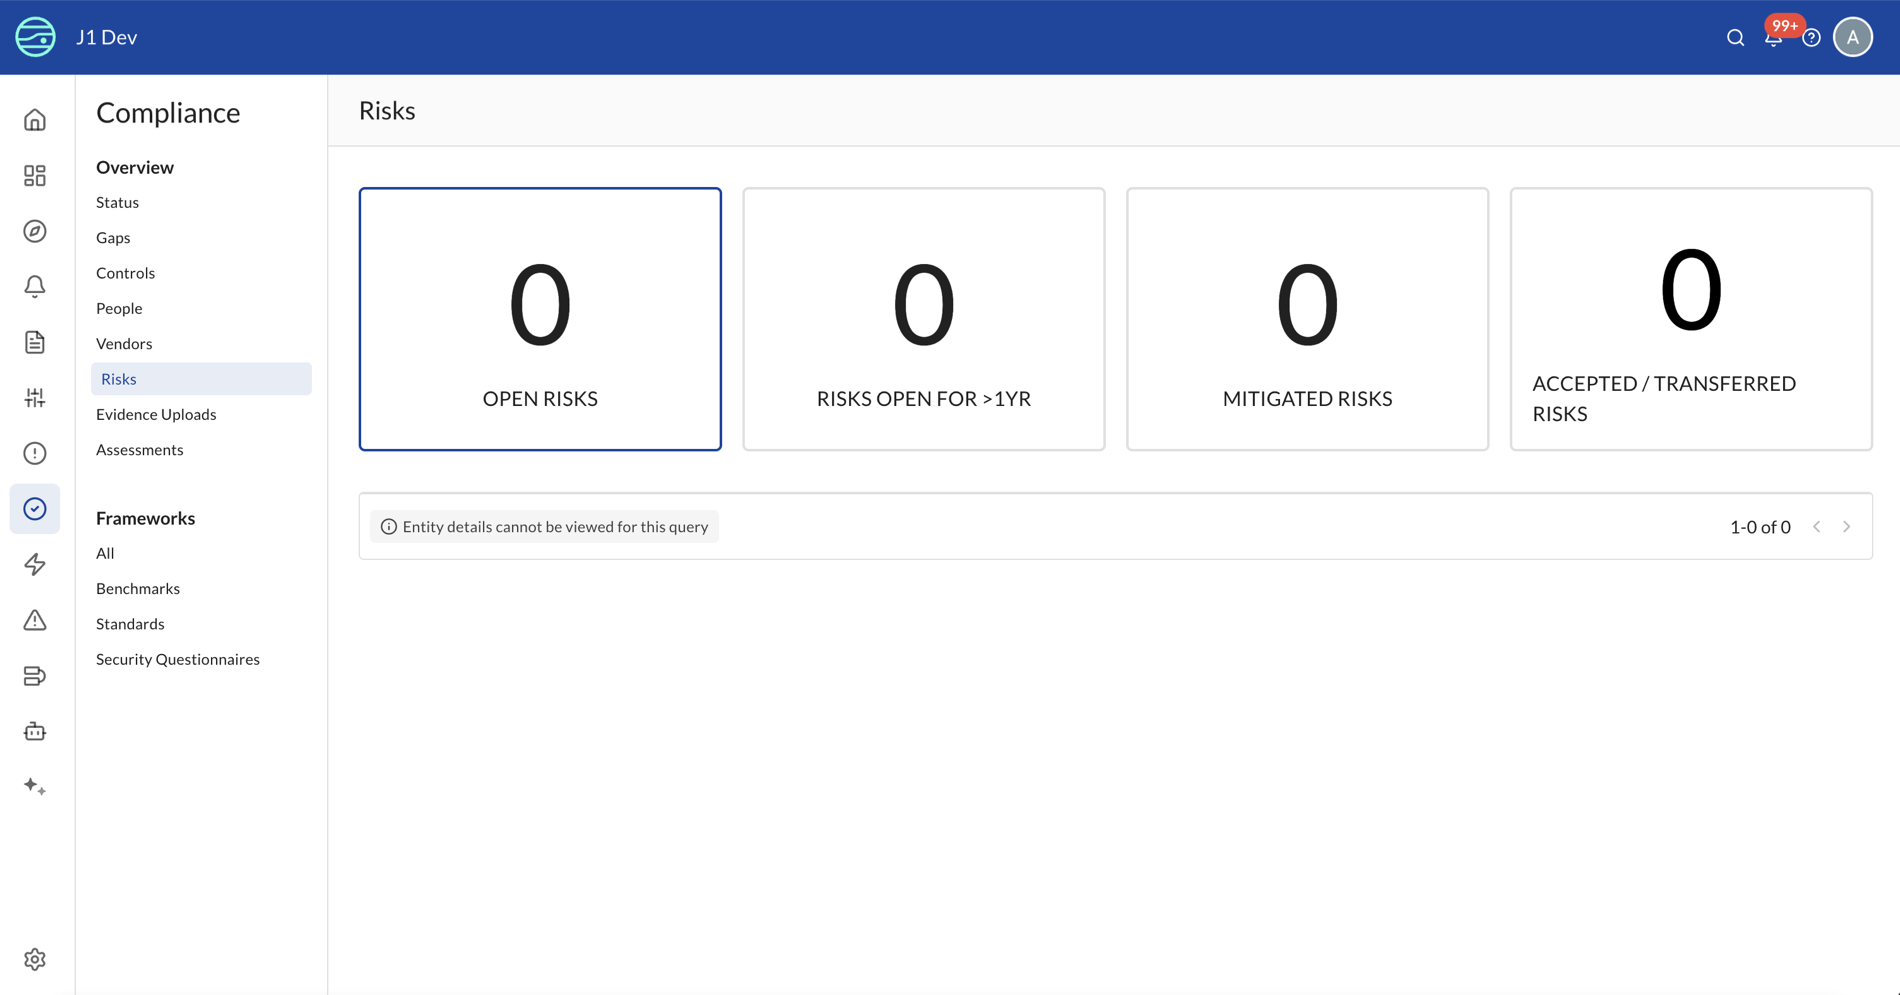
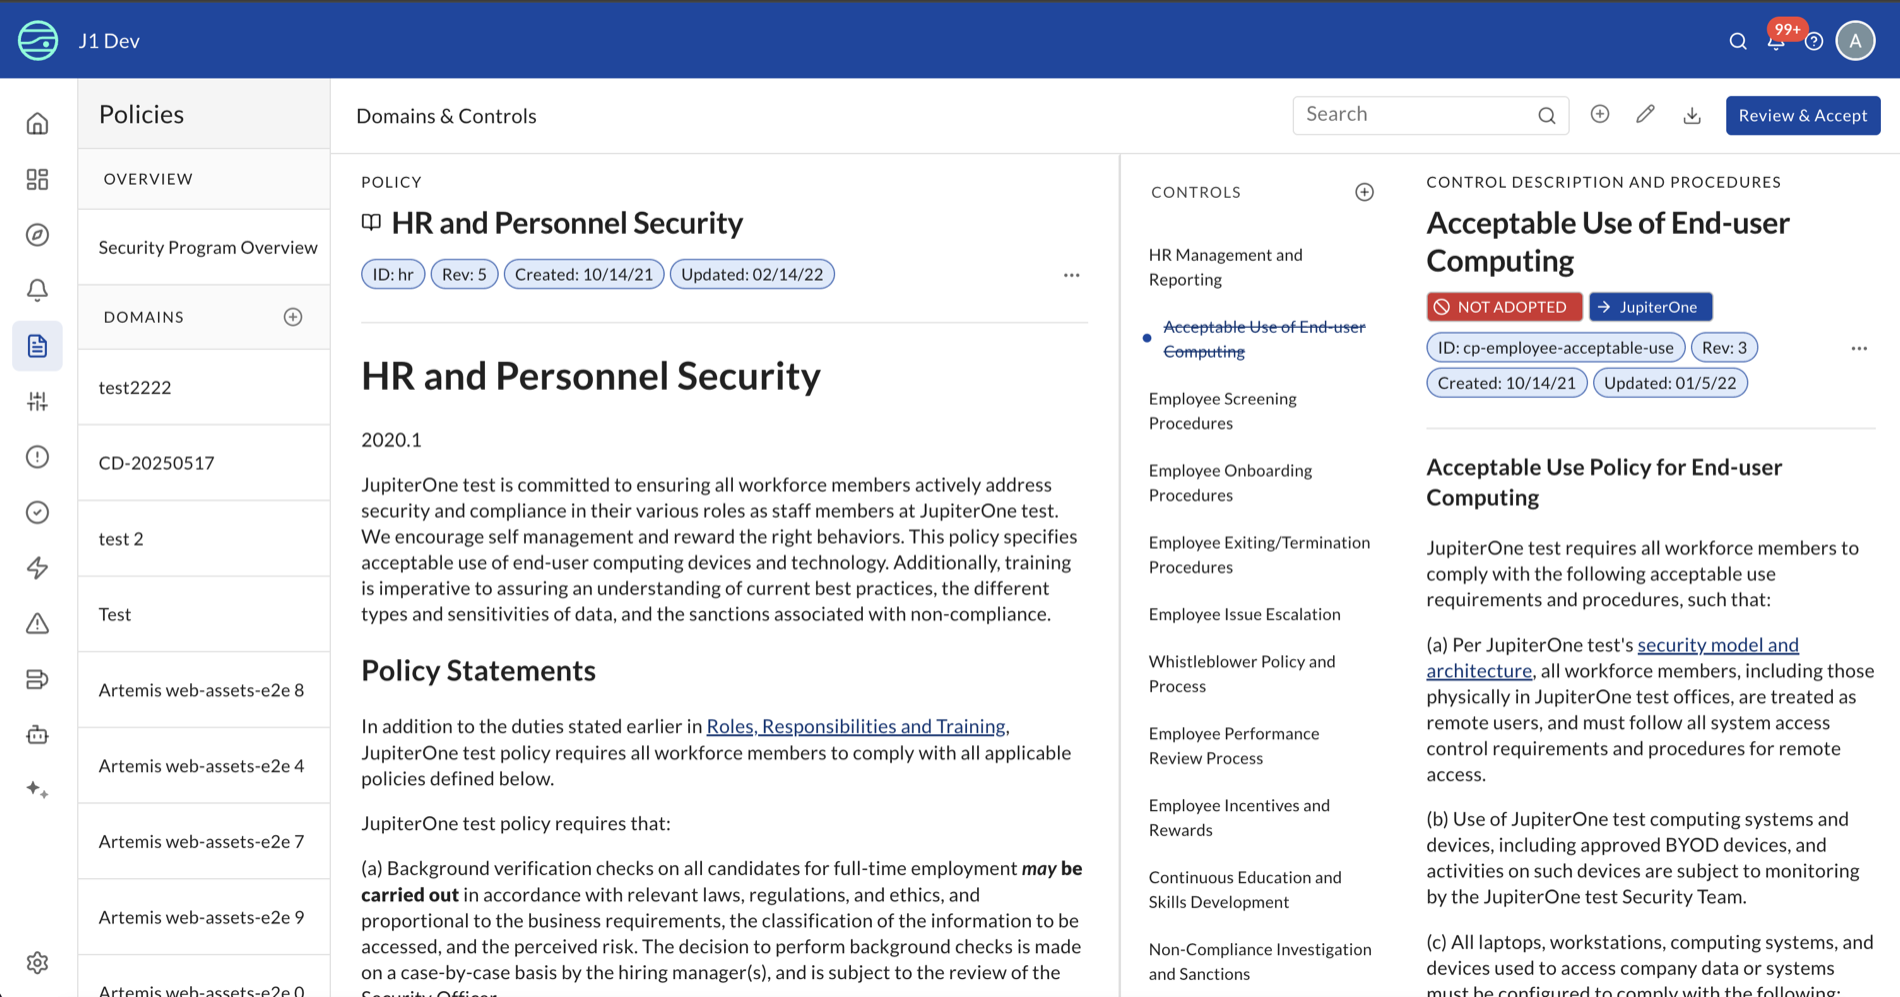
Security teams live in this product every day, so a big-bang rebuild was never an option. I redesigned the foundation first and let every surface inherit it, shipping in slices so nothing went dark for a customer mid-quarter.
Consistency
by construction.
A token-based design system, so every screen behaves the same way, everywhere, by default.
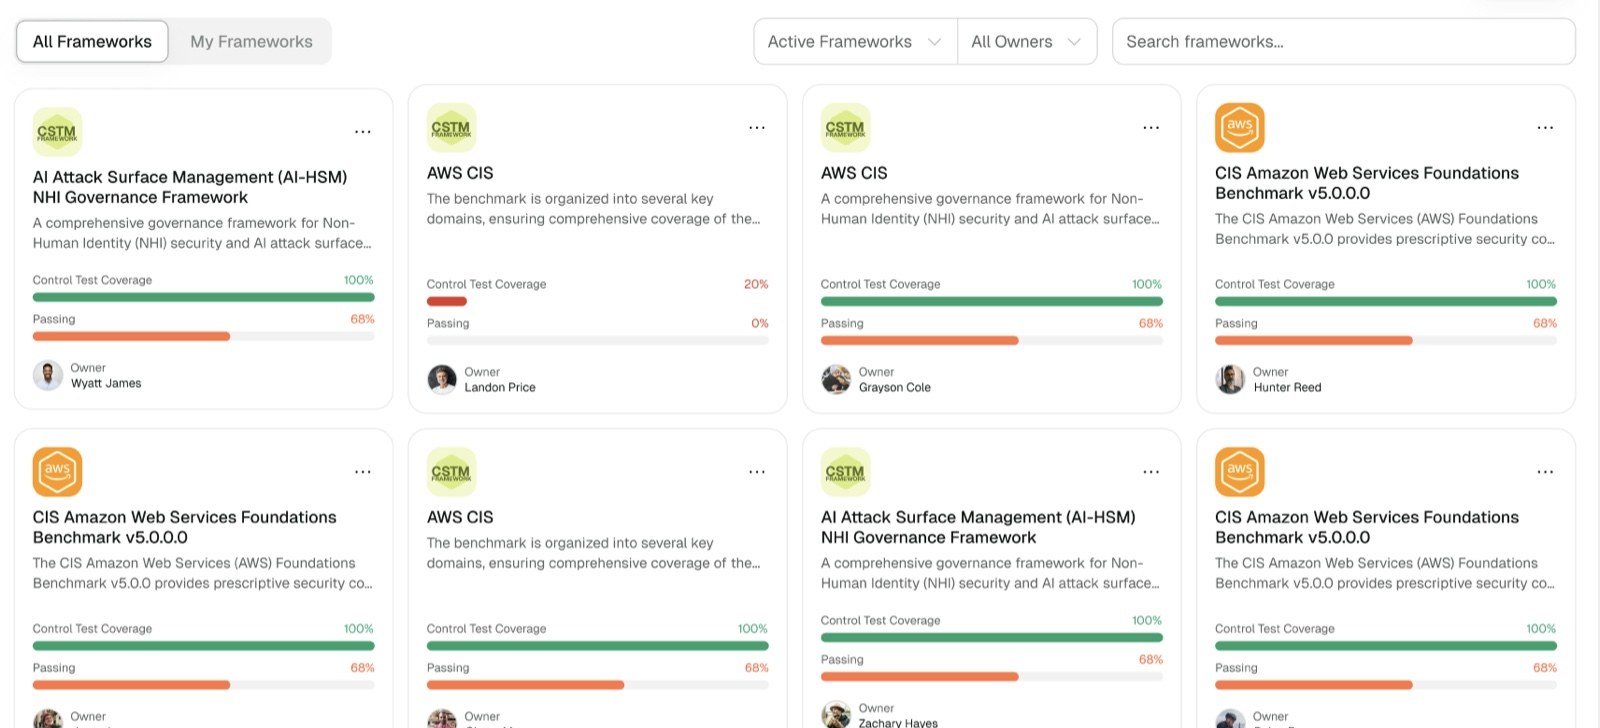
A token-based system decided spacing, type, colour, iconography and interaction once, and every screen inherited it. The bigger shift was underneath: once the system was consistent enough to be read rather than interpreted, I packaged it as a Claude skill and started designing straight into code, opening pull requests alongside engineers instead of handing mockups across a boundary. What the team could build, and how fast, both changed.
The foundation is what let us build the rest.
With the machinery in place, the product could finally look as intelligent as the graph underneath it, and the AI work became possible because the foundation could carry it.
The data model was the most valuable thing in the product and the least legible part of the interface. In the Graph Canvas you build a query and watch the traversal happen, so the shape of a relationship is visible while you are still forming the question.
Organisations were adopting AI faster than they could account for it: models, agents, keys and the identities attached to them, already in the environment and mostly outside anyone's inventory. The same graph could hold all of it.
A security team can't act on an answer it can't verify, so the assistant is built to be checkable. You can ask why, trace any conclusion back to the evidence in the graph, and see where confidence comes from, which shaped what it surfaces, how it shows uncertainty, and what it does when it is wrong.
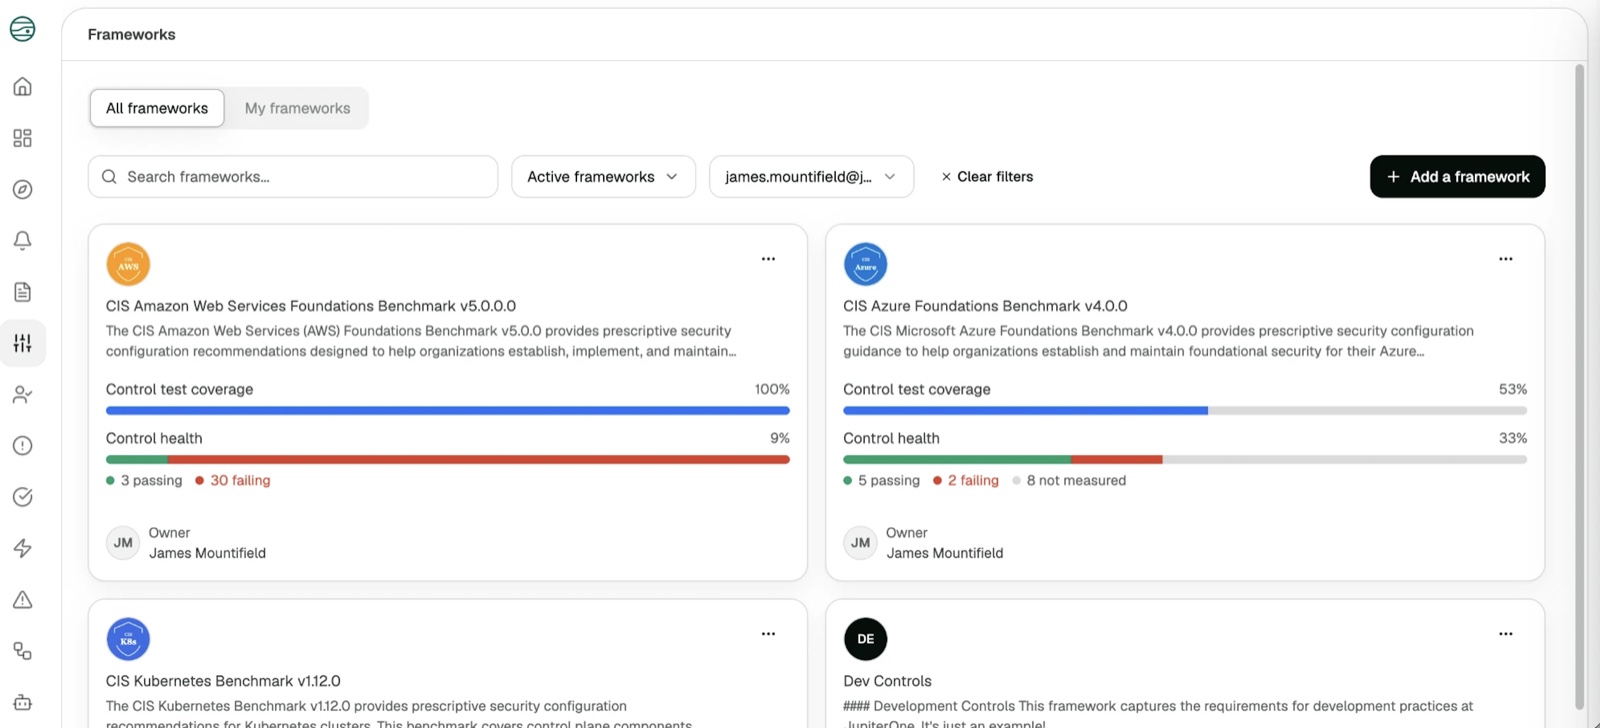
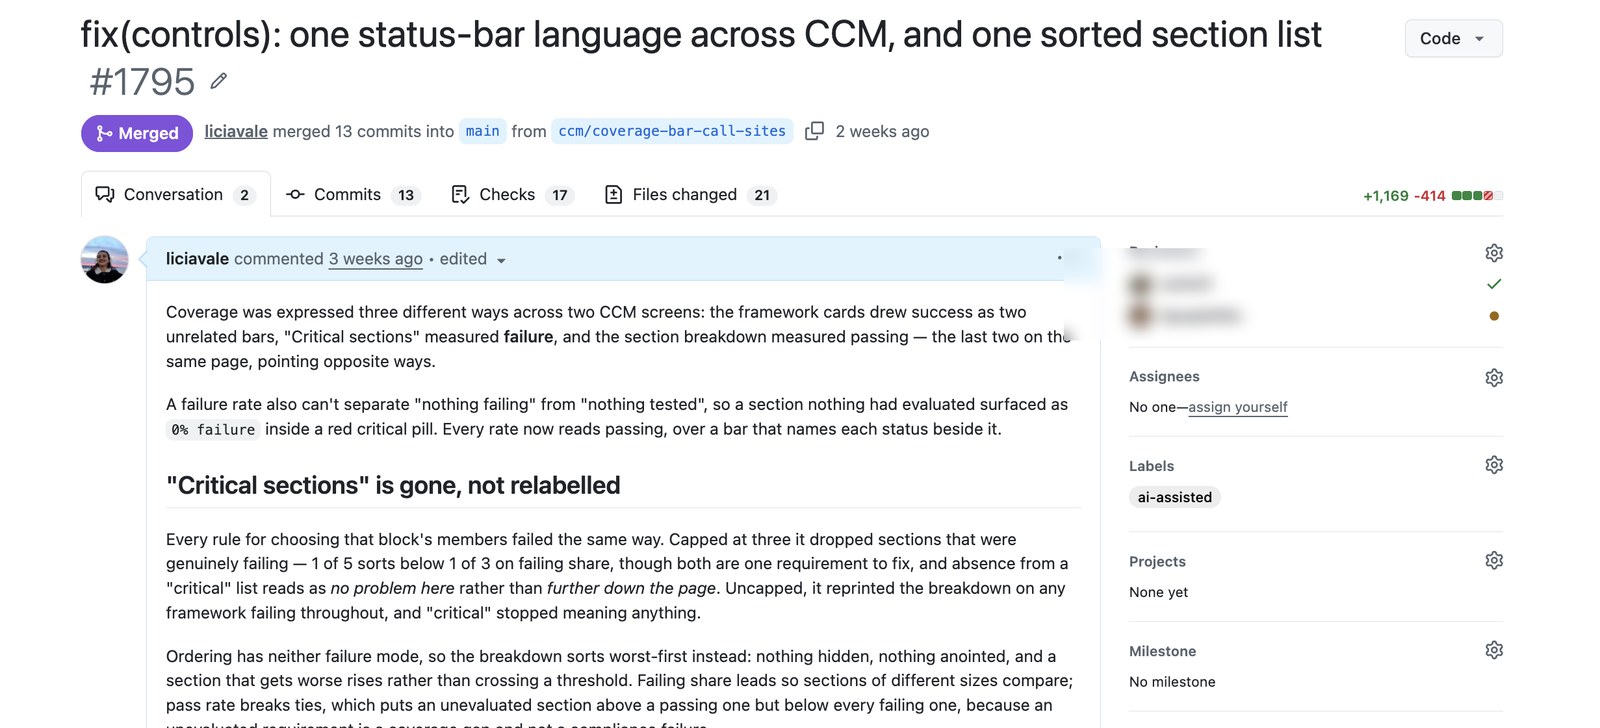
A customer flagged in Jira that coverage read two opposite ways across CCM: the main screen measured the share of controls passing, the requirement screen measured the share failing, so the same data pointed in opposite directions and you couldn't trust it at a glance.
I picked it up and shipped the fix myself. Every screen now reads coverage the same way: one bar that names passing, failing and not-measured side by side. I also redesigned and shipped the new navigation and more. I like working in Visual Studio Code because I can iterate quickly on customer feedback.
NON.O.Head of Security"I honestly like the new look and feel of the UI very much, for the most part. Great job."
PAP.A.Security Lead"It looks like the whole place got a revamp. It's a new world."
TRT.R.Platform Engineer"There's a lot of good things happening recently. I'm seeing all these changes. It's getting better."
EBE.B.CISO"The assets UI looks a lot cleaner already, which I really like."
MFM.F.Security Engineer"I like the new UI. It abides by my dark setting, which is nice, because before, part of it was dark and part of it was light."
DVD.V.Head of Platform"You deployed this whole new application, and it's a huge improvement. It looks better and it works better."
Currently
the J1 design-system skill is shared across the organisation
anyone can prototype against the real design system, not only designers
the design-to-dev handoff is largely gone